
Understand · what it is and why it exists
01What it is
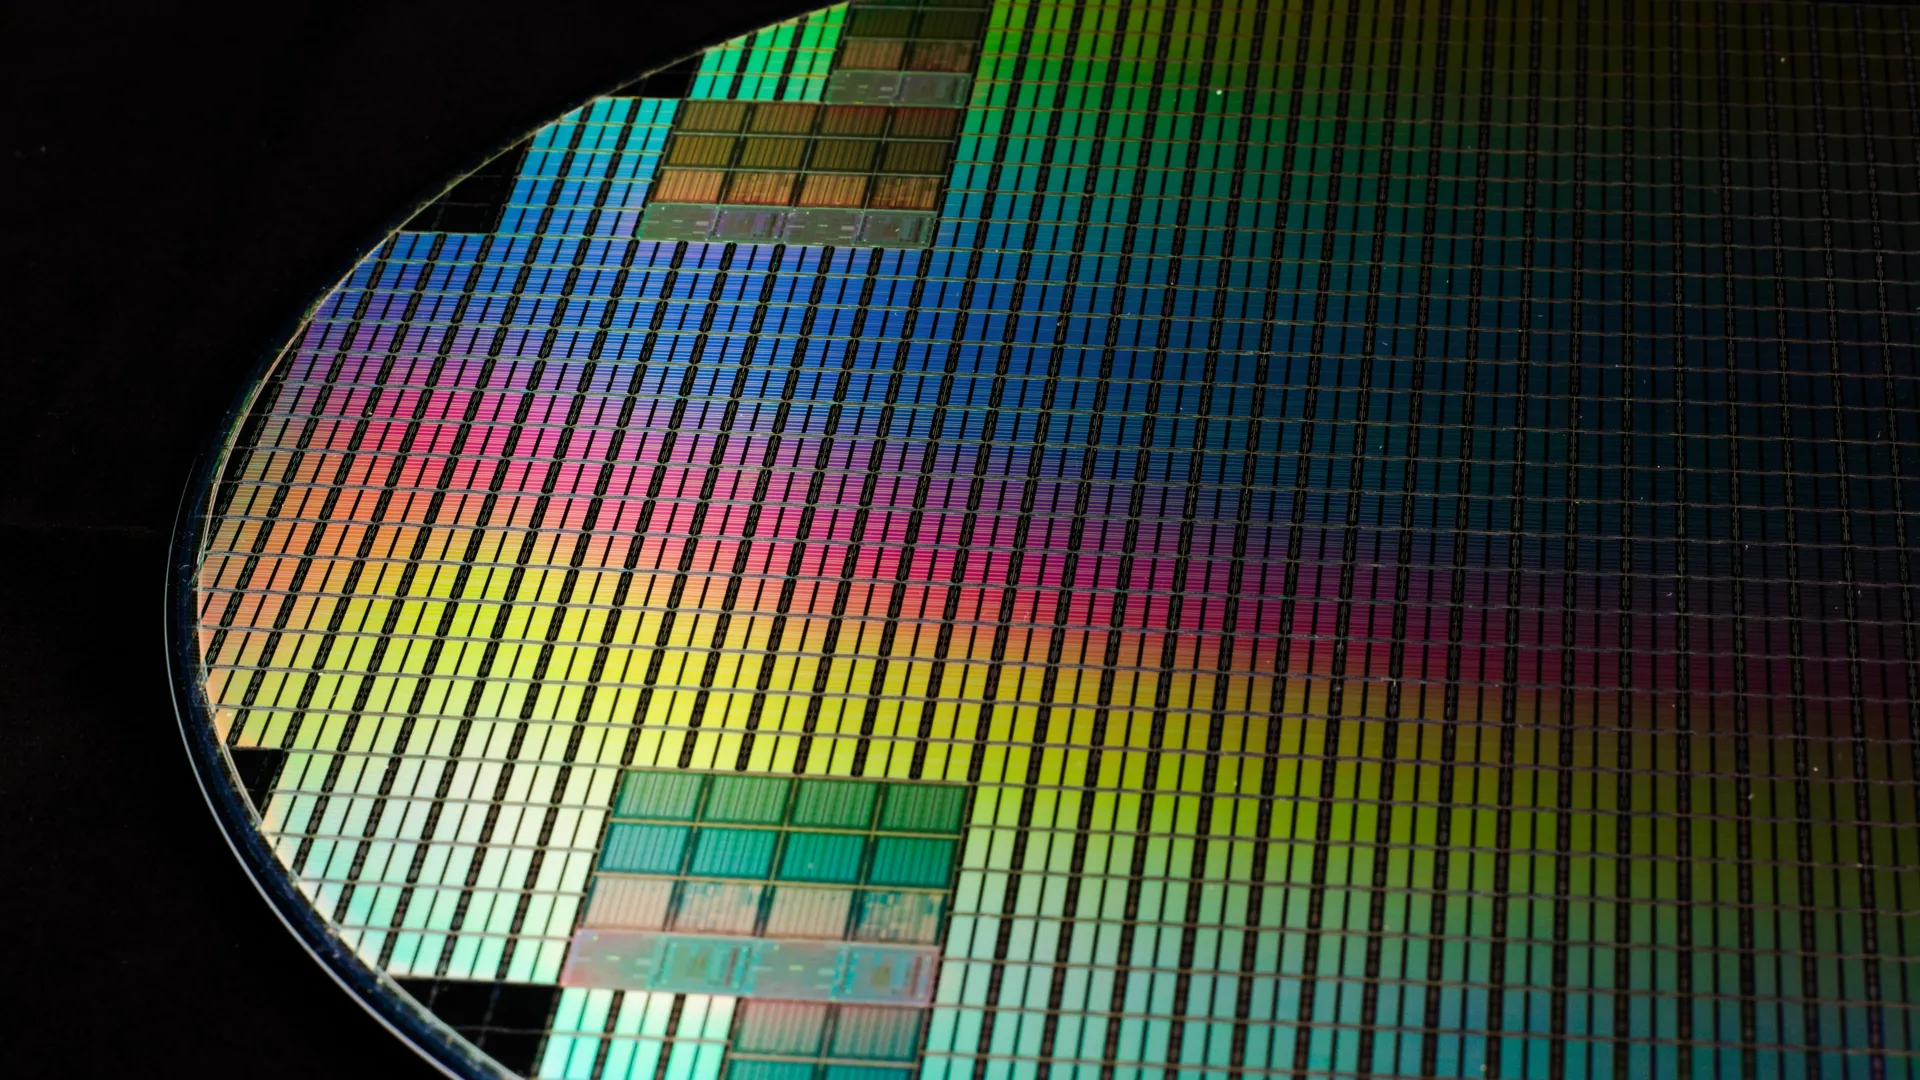
The technology sector contains the companies that make computing possible and sell it: semiconductor designers and manufacturers, software and cloud companies, hardware makers, IT services, and the equipment that builds chips. Its ETF is XLK. Note what it does not contain under the standard classification: the large internet platforms and social networks sit in Communication Services, and the biggest online retailer sits in Consumer Discretionary.
It is the largest sector in the S&P 500 by a wide margin, and it is concentrated: a few giants account for a large share of the sector's weight, and therefore of the index's. When technology leads, the index leads; when it fails, the index usually cannot hold.
It is also the sector most defined by growth expectations. Its companies are valued on earnings years away, which makes them the most sensitive to interest rates and the most rewarded when confidence is high.
02Why it exists
The sector exists as a category because computing became the economy's largest source of new value, and the companies that supply it share drivers: the pace of technology adoption, capital spending by businesses, the cost of money, and — increasingly — the build-out of data centres and AI infrastructure.
It dominates the index because the largest companies in the world are in it. That is a fact about the last decade, not a law of nature; the sector's share of the index has risen and fallen before, and its weight today is the result of the market rewarding its growth.
03How it is measured or observed
Technology is read through its ETF, its largest industries, and the things growth valuations depend on:
- XLK vs SPYThe sector's relative strength line. Rising means technology is leading the market — usually a growth, risk-on tone.
- Semiconductors (SMH / SOX)Chips lead the sector. The semiconductor index is often the first to turn, up or down, and its leadership or failure is the sector's early warning.
- Software vs hardwareSoftware (subscriptions, cloud) and hardware/semis (capital spending, cycles) respond to different things. Leadership inside the sector rotates between them.
- Interest ratesThe 10-year yield. Rising long-term rates compress growth valuations; technology usually underperforms on rate-up days.
- Capital-spending cyclesHow much businesses and cloud providers are spending on equipment and data centres. Semiconductor and equipment companies live on this.
- ConcentrationThe share of XLK held by its top holdings. The sector's move is often three or four companies' move.
Read · seeing it in the market
04How professionals read it
Professionals read technology as the market's growth engine and its risk barometer at once. When XLK leads and semiconductors lead XLK, the market is paying for the future and risk appetite is high. When semis roll over first — as they often do — it is frequently the earliest sign that the growth trade is tiring, weeks before the index notices.
They watch it against rates. Technology underperforming on a day yields rise is normal; technology outperforming through rising yields is a statement that earnings or a specific catalyst are overpowering the rate effect, which is worth noting.
They also separate the sector from its giants. XLK up 2% can mean two giants up 5% and the rest flat. The equal-weight sector and the semiconductor index tell them whether leadership is broad or a few names doing all the work — the same breadth question as everywhere else, one level down.
05What strength looks like
Strong technology leadership looks like XLK outperforming SPY with semiconductors leading XLK, software participating, the largest names making highs together, and the sector absorbing rate moves without losing its relative line. It is usually the core of a broad bull market.
Illustrative. Semiconductors (gold) lead XLK (blue), which leads SPY (navy) — the growth engine at full strength.
Source: illustrative teaching data — not market data
06What weakness looks like
Technology weakness looks like XLK losing its relative line as yields rise, semiconductors failing first, leadership narrowing to one or two giants, and defensive sectors taking over. Because of its weight, technology weakness usually becomes index weakness — which is why professionals watch this sector even when they own nothing in it.
Illustrative. After the midpoint yields (grey) climb and XLK (blue) falls behind SPY (navy).
Source: illustrative teaching data — not market data
07What a divergence looks like
The divergence inside technology to watch: the sector ETF at a high while the semiconductor index and the equal-weight version are not. The giants are carrying it. Narrow leadership in the market's largest sector is the most concentrated form of fragility the index can have.
Broad
- Semiconductors confirming
- Equal-weight tech keeping pace
- Software and hardware both participating
- Sector holds its relative line through rate moves
Giant-only
- Semis lagging or rolling over
- Equal-weight tech flat or down
- Two or three names explain the move
- Relative line slipping on every yield rise
Check before you trust an XLK high.
Interpret · what it means for you
08What it means for an investor
For an investor technology is the largest part of any S&P 500 fund whether or not they chose it. Knowing that is the point: an index fund is a technology-heavy holding, and its future depends on the sector's leadership continuing. The sector has led for a decade and lagged badly in other decades. Diversification refers to holdings whose drivers are not the price of the future.
09What it means for a trader
For a trader technology is where most stocks in play live and where the index's tone is decided. The Advanced program's watchlist usually starts here: semiconductors for leadership, software for catalysts, the giants for the index's direction. Every growth name is read against QQQ and XLK before it is traded.
10What it cannot tell you
- The sector label is blunt: semis, software and hardware can diverge sharply from each other.
- XLK excludes the largest internet platforms (Communication Services) and the biggest online retailer (Consumer Discretionary). 'Tech' in the news is broader than the sector.
- A strong XLK does not mean a strong average technology stock; concentration is extreme.
- A decade of leadership says nothing certain about the next one.
Apply · the market right now
11What is happening right now
MAAL TRADING ACADEMY market note
No dated note has been published for this topic yet. We only publish current-market commentary written and dated by the academy — nothing auto-generated.
Data · previous close
Live levels for XLK, SMH, QQQ, SPY appear here once the licensed market-data feed is connected. We do not show unlicensed or made-up numbers.
How to check this yourself today
- Chart XLK ÷ SPY over six months. Rising or falling?
- Compare the semiconductor ETF (SMH) with XLK over one month — are chips leading?
- Check XLK's top five holdings and their combined weight.
- Note the 10-year yield's direction over two weeks and whether XLK's relative line moved opposite to it.
12Visual market example
The sector's anatomy in one picture: semiconductors lead, the sector follows, the index follows the sector. When chips roll over — the gold line first — the rest follow in order. Reading technology means reading its leaders, and its leaders are the chips.
Illustrative. The order of leadership is also the order of warning.
Source: illustrative teaching data — not market data
Review · practise, keep, connect
13Test your understanding
Read the chart the way you would before a trade. Pick the answer, then read why.
1XLK is up 3% on the month at a new high. SMH (semiconductors) is down 4%. Equal-weight technology is flat. How would you describe the sector?
Illustrative.
Source: illustrative teaching data — not market data
14Key takeaways
- Technology is the largest and most concentrated sector; its leadership is the index's leadership.
- Semiconductors lead the sector and usually turn first — up and down.
- It is the most rate-sensitive sector; read XLK against the 10-year yield.
- Check semis and equal-weight before trusting an XLK high.
- 'Tech' in the news is broader than the sector: platforms and the big retailer sit elsewhere.
16Learn it in class
Advanced Program · Stage 1 · Finding Stocks in Play
Most Advanced watchlists start in technology: semiconductors for leadership, software for catalysts — every name read against QQQ and XLK first.