
Understand · what it is and why it exists
01What it is
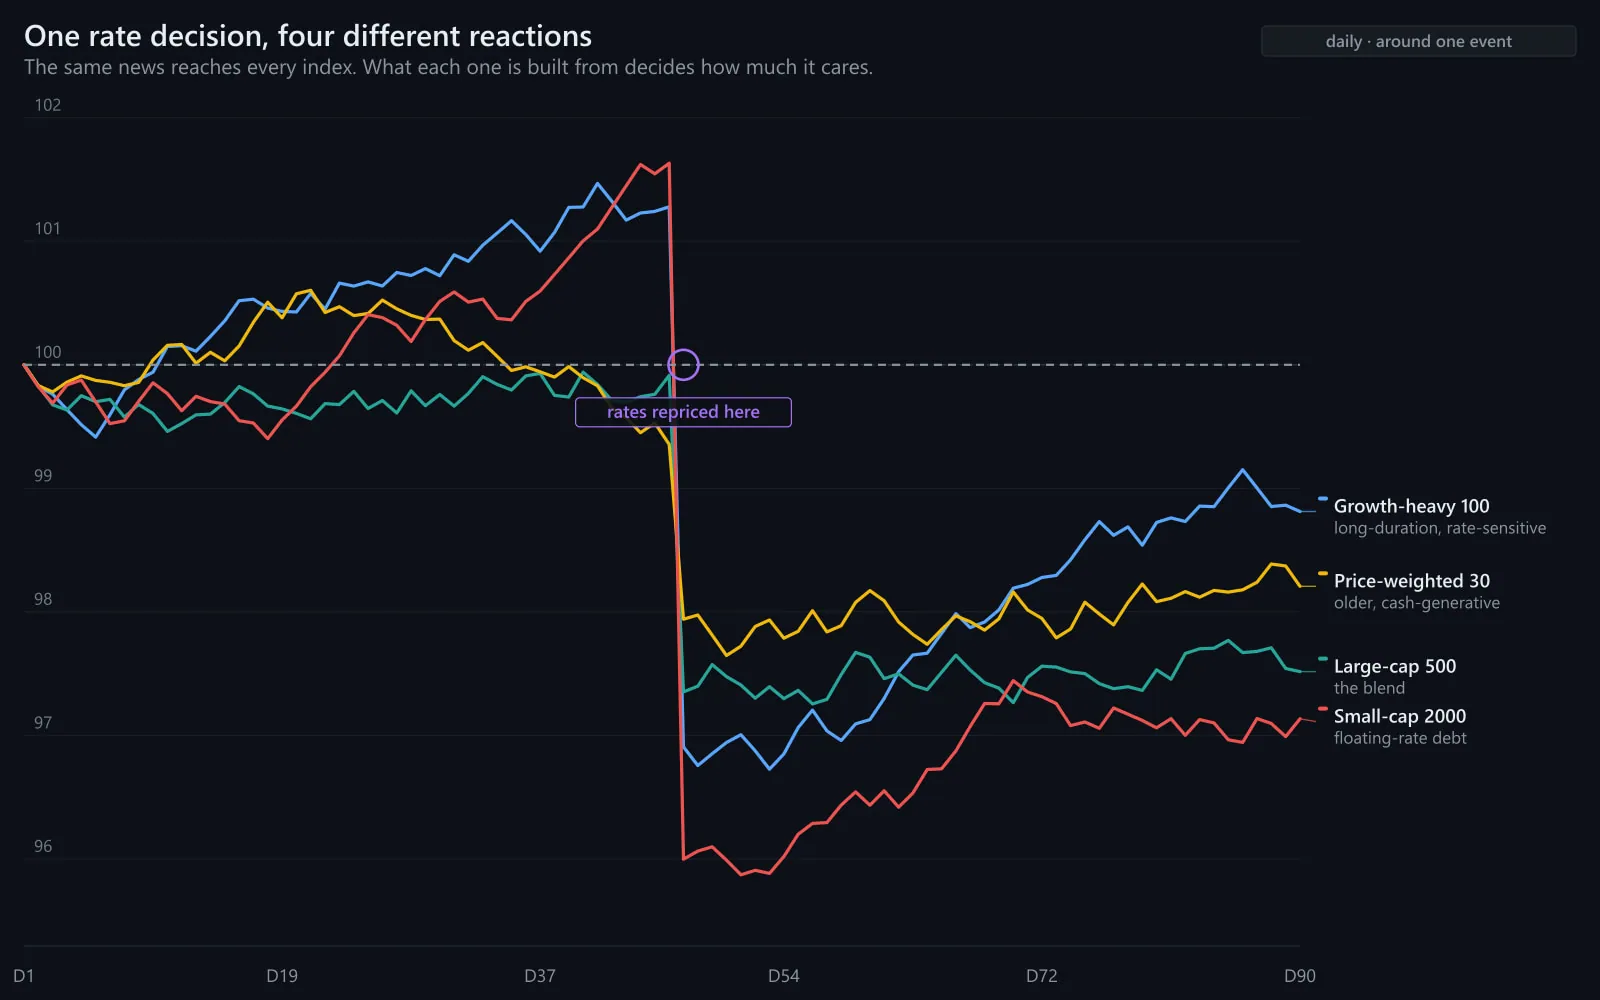
Each index is sensitive to different things because each contains different companies. The Nasdaq-100 reacts hardest to interest rates because growth companies are valued on distant earnings. The Russell 2000 reacts to rates and credit because small companies borrow. The energy sector reacts to oil. Financials react to the shape of the yield curve. The Dow reacts to whichever of its high-priced members reported last night.
Knowing what moves each index is how you make sense of a day when the headlines say one thing and the tape says several. 'Stocks fell on rate fears' is a useful sentence only if you know that 'stocks' means QQQ and IWM fell hard while utilities and staples barely moved.
It is also the foundation of reading a session's driver: if you know what each index is sensitive to, the pattern of which ones moved tells you the cause.
02Why it exists
Sensitivities exist because of business models. A company with earnings far in the future is worth less when rates rise; a bank earns more when the gap between short and long rates widens; an oil producer earns more when oil rises; an exporter earns less when the dollar strengthens. Indexes inherit the sensitivities of their members in proportion to their weights.
They persist because those relationships are structural, not fashionable. The weights change and the magnitudes vary, but growth's rate sensitivity and energy's oil sensitivity are features of what those businesses are.
03How it is measured or observed
The main drivers and the indexes that feel them most:
- Long-term interest rates (10-year yield)Rising yields hurt long-duration growth (QQQ) and indebted small caps (IWM) most; utilities and real estate also suffer as their dividends compete with bonds. Financials can benefit.
- Earnings and guidanceIndex-level earnings seasons move everything, but a single giant's report moves QQQ and SPY directly through its weight. The Dow moves on its high-priced members' reports.
- Economic growth dataJobs, manufacturing, consumer spending. Cyclical sectors (industrials, discretionary, financials) and small caps react most; defensives least.
- The U.S. dollarA stronger dollar weighs on large multinationals' foreign earnings (SPY, QQQ) and is neutral to positive for domestic small caps (IWM).
- Oil and commoditiesEnergy and materials sectors move with them; transport and consumer sectors move against them.
- Risk appetite and volatilityWhen fear rises, the most volatile indexes (QQQ, IWM) fall most; the VIX rises; defensives outperform. When it falls, the reverse.
Read · seeing it in the market
04How professionals read it
Professionals use sensitivities as a diagnostic. On a day when the S&P falls, they look at which indexes and sectors fell most. QQQ and IWM down hardest with yields up: a rates day. Energy up and everything else down: an oil shock. Everything down equally with the VIX spiking: a risk-off day. The pattern of the moves is the fingerprint of the cause.
They also use them to anticipate. If a rate decision is due at 1:00 PM Central, they know QQQ and IWM will carry the reaction; if a giant technology company reports tonight, they know QQQ gaps tomorrow. The calendar plus the sensitivity map is most of what 'preparation' means.
And they watch for broken relationships. When QQQ rallies through rising yields, or energy falls while oil rises, something else is in charge. Broken sensitivities are often the first sign that the market's driver has changed.
05What strength looks like
Sensitivities are easiest to see when one driver dominates. In a rate-driven stretch, QQQ and yields move in a near-perfect mirror: yields fall, growth rises; yields rise, growth falls. The rest of the market responds more mildly.
Illustrative. QQQ (gold) moves inversely to yields (grey) on rate-driven days.
Source: illustrative teaching data — not market data
06What weakness looks like
Energy's sensitivity is the same idea in the other direction: the energy sector tracks oil closely, often regardless of what the broad market is doing. When oil rises sharply the energy ETF can be green on a red day — and a trader reading only SPY would have no idea why.
Illustrative. XLE (gold) follows crude oil (grey) far more closely than it follows the S&P.
Source: illustrative teaching data — not market data
07What a divergence looks like
The divergence that matters here is a broken sensitivity: growth rising into rising yields, small caps rallying while credit tightens, energy ignoring oil. A broken relationship is not a bug; it is a sign that a stronger driver has taken over, and finding it is the day's job.
Driver
- Rates up
- Growth data weak
- Oil spike
- Dollar strong
- Fear / risk-off
Fingerprint
- QQQ, IWM, utilities, REITs down; banks hold
- Cyclicals, small caps down; defensives hold
- Energy up; transports, consumer down
- Multinationals (SPY, QQQ) lag domestic (IWM)
- QQQ, IWM down most; VIX up; defensives lead
Which indexes move, and how, points to the cause.
Interpret · what it means for you
08What it means for an investor
For an investor the sensitivity map explains why a portfolio behaves the way it does. A heavy S&P 500 holding is a heavy technology holding, which is a bet that rates stay tolerable. Adding small caps adds a bet on the domestic economy and credit. The map turns 'diversified' from a word into a set of exposures you can actually name.
09What it means for a trader
For a trader it is the preparation checklist: knowing the day's scheduled drivers, knowing which indexes carry each reaction, and sizing for the index really being traded — a semiconductor stock on a rate-decision day is a leveraged QQQ trade whether or not it was meant to be.
10What it cannot tell you
- Sensitivities describe tendencies, not laws. Growth sometimes rallies through rising rates; energy sometimes ignores oil.
- Magnitudes vary with the regime. The same yield move produces different reactions in calm and volatile markets.
- Multiple drivers overlap. Most days are a mix, and the fingerprint is blurred.
- Correlations change. A relationship that held for a decade can weaken for a year.
Apply · the market right now
11What is happening right now
MAAL TRADING ACADEMY market note
No dated note has been published for this topic yet. We only publish current-market commentary written and dated by the academy — nothing auto-generated.
Data · previous close
Live levels for QQQ, IWM, XLE, XLU appear here once the licensed market-data feed is connected. We do not show unlicensed or made-up numbers.
How to check this yourself today
- List the scheduled drivers for the week: central-bank decisions, inflation and jobs data, major earnings.
- For each, name the indexes and sectors that should react most.
- Check the 10-year yield, oil and the dollar over the last month and compare with QQQ, XLE and IWM.
- Look for any relationship that has broken recently — that is where the current driver is.
12Visual market example
Two relationships on one page: growth mirrors yields; energy follows oil. Neither index is 'the market'; each is a function of its own driver. A trader who knows the map can read a red S&P day quickly — which index bled, what moved with it, and therefore why.
Illustrative. Growth (gold) against yields (grey): inverse. Energy (blue) against oil (navy): direct.
Source: illustrative teaching data — not market data
Review · practise, keep, connect
13Test your understanding
Read the chart the way you would before a trade. Pick the answer, then read why.
1SPY −1.2%, QQQ −2.4%, IWM −2.0%, utilities −1.5%, banks +0.3%, 10-year yield up sharply. What drove the day?
Illustrative.
Source: illustrative teaching data — not market data
14Key takeaways
- Each index inherits the sensitivities of its members: QQQ to rates, IWM to rates and credit, energy to oil, multinationals to the dollar.
- The pattern of which indexes moved is the fingerprint of the day's driver.
- Use the map to prepare: know which index carries each scheduled event.
- Broken relationships mean a stronger driver has taken over — find it.
- Sensitivities are tendencies, not laws; magnitudes change with the regime.
16Learn it in class
Advanced Program · Stage 1 · Finding Stocks in Play
Advanced Day 1: catalysts are mapped to the indexes and sectors that carry them before the watchlist is built — the sensitivity map is the first page of the morning.