
Understand · what it is and why it exists
01What it is
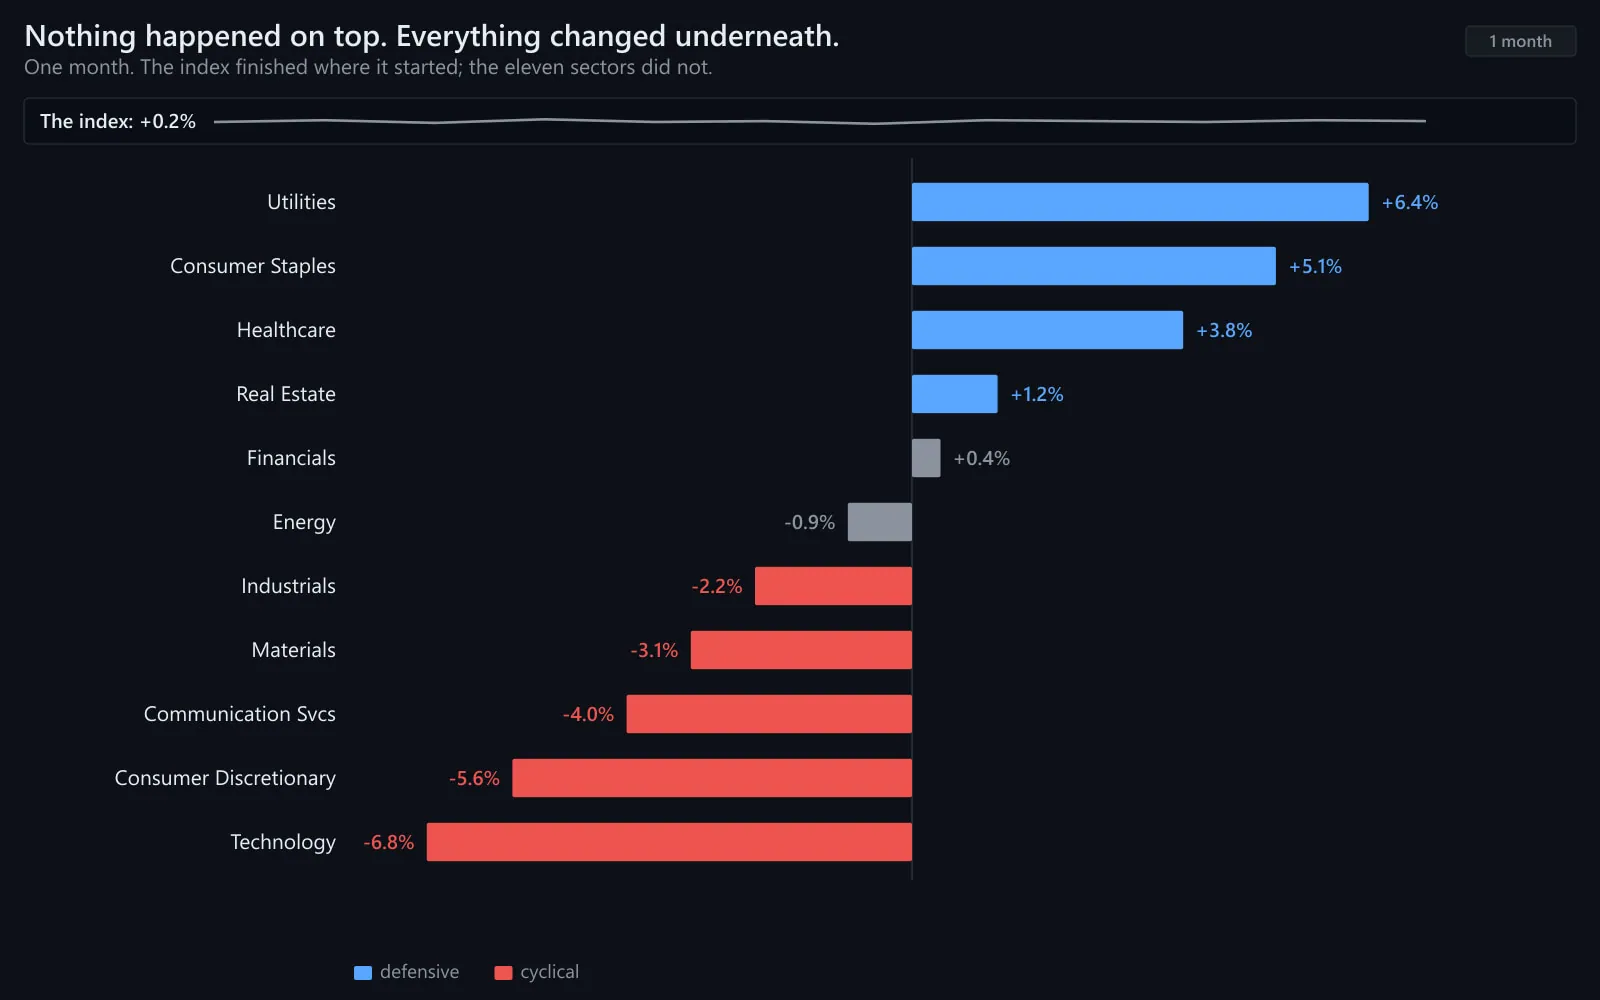
Leadership is the question of which stocks, industries and sectors are doing better than the market, and weakness is the question of which are doing worse. At any moment some groups are pulling the index up and others are holding it back. The index is the net result; leadership is the composition.
It matters because the market is not one thing. It is eleven sectors, dozens of industries and thousands of companies, and money moves between them constantly. When it moves from technology into utilities, the index may barely change while the character of the market changes completely.
Reading leadership is reading what the market is rewarding right now — growth or safety, cyclicality or stability, risk or caution — without anyone having to say it out loud.
02Why it exists
Leadership exists because capital rotates. Investors and funds are always choosing between groups based on expectations: earnings growth, interest rates, the economy, a new technology, a policy change. Those choices show up as relative performance long before they show up in headlines.
It also exists because of index construction. A cap-weighted index is led by its largest members by definition; when the largest members are all in one sector, that sector's fortunes become the index's fortunes. Leadership can be genuinely broad or just mathematically inevitable, and telling the two apart is part of the skill.
03How it is measured or observed
Leadership is measured by comparing groups with each other and with the market:
- Sector performance tableThe eleven S&P sectors ranked by return over a day, a week, a month and three months. Who is top, who is bottom, and has the order changed?
- Relative strength lineA group's price divided by the market's price, plotted over time. Rising means the group is outperforming; the direction of the line matters more than its level.
- Cyclical vs defensiveTechnology, discretionary, industrials and financials are broadly cyclical (they do well when growth is expected). Utilities, staples and healthcare are defensive (they hold up when it is not). Which side leads is the market's tone.
- Growth vs valueGrowth indexes versus value indexes. Growth leading usually means investors are paying for the future; value leading usually means they want earnings now.
- New highs listWhich sectors and industries dominate the stocks making 52-week highs. Leadership is where the new highs are.
- Breadth within the leaderIs the leading sector being carried by most of its members or by two giants? Leadership with narrow breadth is fragile.
Read · seeing it in the market
04How professionals read it
Professionals read leadership for tone first. A market led by technology and consumer discretionary is saying it expects growth; one led by utilities, staples and healthcare is saying it wants shelter. Neither is a prediction, but each is a description of what participants are paying for, and it changes slowly enough to be useful.
They watch for rotation rather than collapse. Money leaving one group rarely leaves the market; it goes somewhere else. A market where leadership rotates — technology pauses while industrials take over — is often healthier than one where a single group leads for months and then fails with nothing behind it.
They also check the breadth of the leader. A sector up 5% on the month is one thing if most of its members rose and another if two of them doubled. Narrow leadership within a narrow market is the most fragile combination there is.
And they hold the reading lightly. Leadership changes at turning points, and the early stages of a change look like noise. Confirmation takes weeks, not hours.
05What strength looks like
Healthy leadership looks like a rising market where cyclical groups lead, the leading sector has broad participation, and rotation happens without the index breaking: technology rests while financials and industrials take the baton, then growth resumes. New highs are spread across several sectors.
Illustrative. Technology (gold) leads, the market (navy) follows, utilities (grey) lag — a growth tone.
Source: illustrative teaching data — not market data
06What weakness looks like
Fragile leadership looks like a market held up by one sector — or one industry inside it — while everything else drifts; or a market where the leaders are defensive groups, which usually means participants are buying shelter rather than growth. The index can look fine in both cases. The composition says otherwise.
Illustrative. After the midpoint technology (gold) fades and utilities (grey) take over while the market (navy) flattens — a change of tone.
Source: illustrative teaching data — not market data
07What a divergence looks like
The leadership divergence to watch is a new index high led by a shrinking group: the same few names carrying the number while the sector table underneath it turns red. It has preceded corrections, and it has also lasted longer than anyone expected. It tells you about fragility, not timing.
Healthy
- Several sectors near highs
- Cyclical groups leading
- Leaders have broad internal breadth
- Rotation happens without a breakdown
Fragile
- One sector, or one industry, carrying the index
- Defensive groups quietly leading
- Leader carried by a few giants
- New highs concentrated in one group
What to check in the sector table.
Interpret · what it means for you
08What it means for an investor
An investor uses leadership to understand what they own. An S&P 500 fund that is a third technology is a bet on technology leadership whether or not you intended it. Knowing the current leaders — and how concentrated they are — is the difference between owning the market and owning a theme by accident.
By the time a group is obviously leading, much of its move may be behind it — one reason many long-term investors hold several groups rather than chase the current leader.
09What it means for a trader
A trader uses leadership to pick the pond. Stocks in a leading sector have the crowd behind them, which is why traders often look there first for breakouts. Stocks in a lagging sector need their own catalyst to move against the tide. The Advanced program's first hour — finding stocks in play — starts with the sector table.
Intraday, leadership is read the same way on a shorter clock: which sectors are green from the open, whether the leaders are holding, and whether money is rotating rather than leaving.
10What it cannot tell you
- Leadership does not predict how long it will last. Groups can lead for years or weeks.
- A defensive tone is not a sell signal, and a growth tone is not a buy signal. Both describe; neither instructs.
- Sector labels are blunt. 'Technology' contains semiconductors, software and hardware, which can diverge sharply from each other.
- Relative strength lines can rise because a group fell less, not because it rose. Check the absolute move too.
Apply · the market right now
11What is happening right now
MAAL TRADING ACADEMY market note
No dated note has been published for this topic yet. We only publish current-market commentary written and dated by the academy — nothing auto-generated.
Data · previous close
Live levels for XLK, XLF, XLE, XLU, XLP appear here once the licensed market-data feed is connected. We do not show unlicensed or made-up numbers.
How to check this yourself today
- Pull up the eleven S&P sector ETFs (XLK, XLF, XLE, XLI, XLV, XLY, XLP, XLC, XLU, XLRE, XLB) and rank them by one-month return.
- Ask: are the top three cyclical (growth tone) or defensive (caution tone)?
- Compare the leading sector with its equal-weight version if one exists. Is the leadership broad inside the sector?
- Look at the new-highs list. Which groups dominate it?
12Visual market example
The classic picture: a market rises under technology leadership, then the tone changes. Technology stops outperforming, utilities start, and the index flattens without falling. A reader watching only the index sees a pause. A reader watching leadership sees the market quietly changing its mind about what it wants to own.
Illustrative. Growth leadership (gold) gives way to defensive leadership (grey) while the market (navy) goes sideways.
Source: illustrative teaching data — not market data
Review · practise, keep, connect
13Test your understanding
Read the chart the way you would before a trade. Pick the answer, then read why.
1One-month sector returns: Utilities +5%, Staples +4%, Healthcare +3%, Technology −2%, Discretionary −3%. What is the market's tone?
Illustrative.
Source: illustrative teaching data — not market data
2Technology is up 6% on the month. Inside it, two giant companies are up 15% and most members are flat. How would you describe the leadership?
Illustrative.
Source: illustrative teaching data — not market data
14Key takeaways
- The index is the net; leadership is the composition. Read both.
- Cyclical leaders mean a growth tone; defensive leaders mean a caution tone. Neither is a signal.
- Rotation is healthy; a single group carrying everything is fragile.
- Check breadth inside the leader — a sector led by two giants is not broad leadership.
- Leadership changes slowly and confirms over weeks, not hours.
16Learn it in class
Advanced Program · Stage 1 · Finding Stocks in Play
Advanced Day 1: the sector table is the first screen you open. Stocks in play are found in leading groups before anything else.