
Understand · what it is and why it exists
01What it is
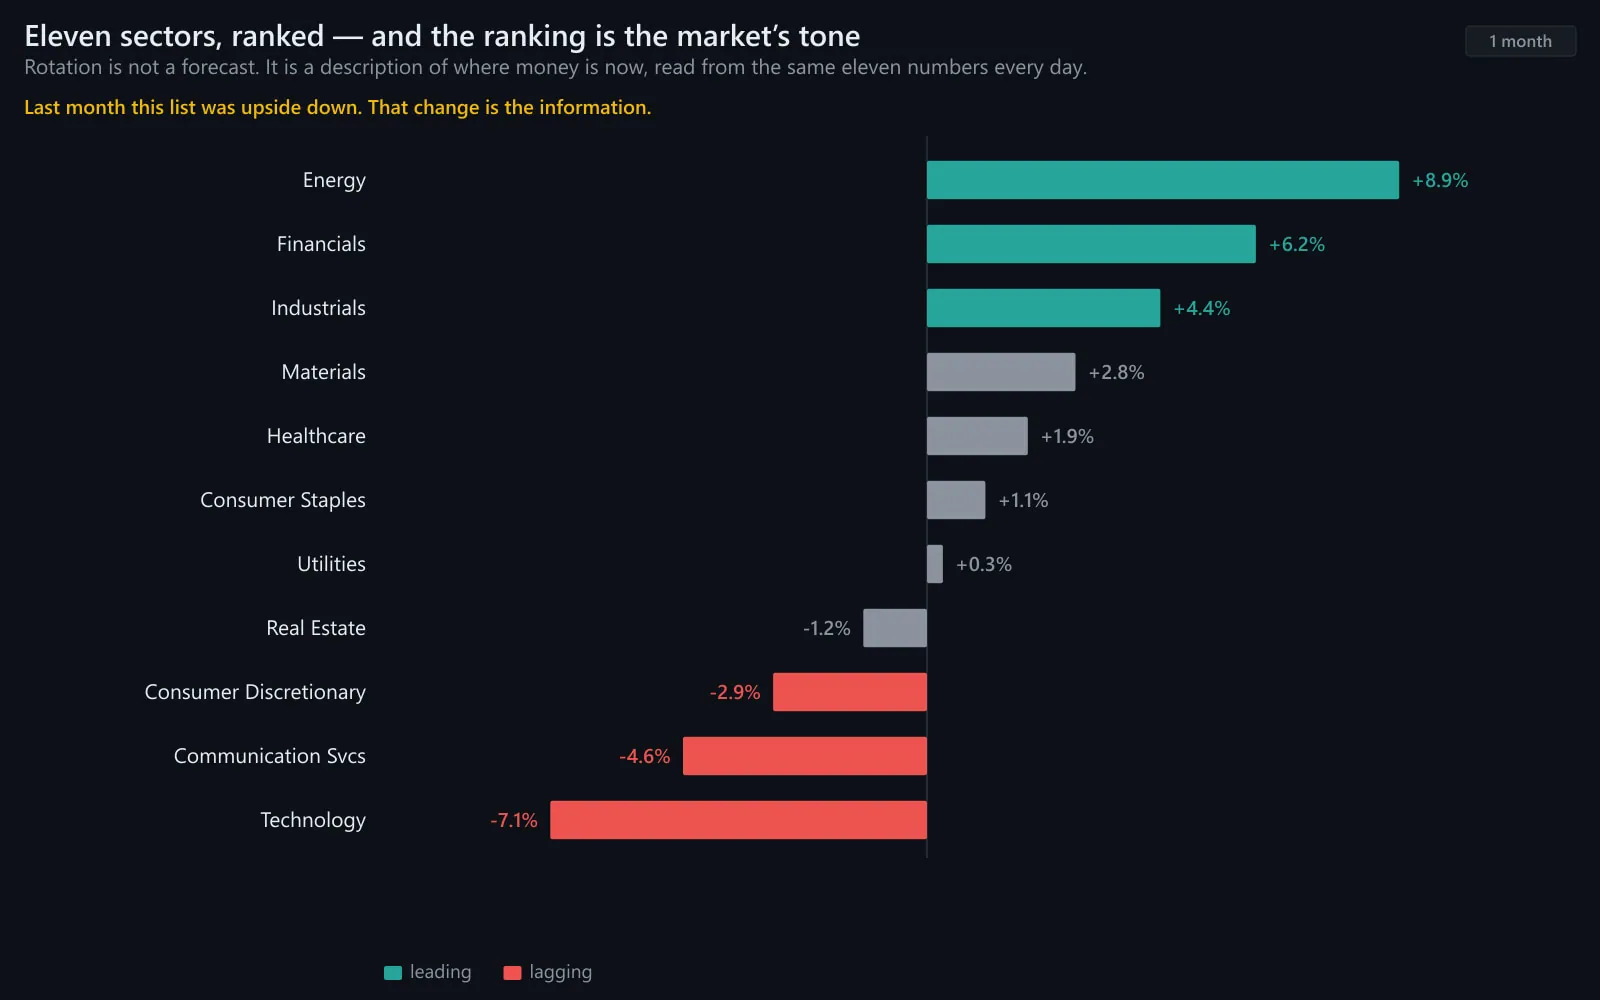
Sector leadership is the ranking of the eleven sectors by performance over a period, and rotation is the change in that ranking over time. At any moment some sectors are pulling the index up and some are dragging it; over weeks and months, money moves between them as expectations change.
Reading it is the fastest way to understand the market's character without looking at a single stock. Technology and discretionary on top is a growth tone; utilities and staples on top is caution; energy on top is inflation or supply; financials and industrials on top is a reflation bet. The order is the message.
This page is the method. Each sector has its own article in this category; this one is about reading them together.
02Why it exists
Rotation exists because capital has to go somewhere. When investors sell one group, they usually buy another rather than leaving the market; that is why a rotation can change the market's entire character while the index barely moves. The sector table makes the movement visible.
It matters because the same index level can describe very different markets. 'SPY flat on the month' can mean nothing happened, or that technology fell 6% and energy rose 10%. Only the sector table distinguishes them.
03How it is measured or observed
Sector leadership is measured with a small set of comparisons, repeated at several horizons:
- The ranking tableEleven sectors sorted by return over 1 day, 1 week, 1 month, 3 months. Read all four columns; the short ones show today's money, the long ones show the trend.
- Relative strength linesEach sector ÷ SPY. The slope is leadership; a line crossing from falling to rising is rotation beginning.
- Cyclical vs defensiveGroup the eleven: cyclicals (technology, discretionary, industrials, financials, materials, energy) against defensives (utilities, staples, healthcare). Which group leads is the tone.
- Breadth of leadershipHow many sectors are above their own 50-day averages. Six or more = broad; two or three = narrow.
- Leader's internal breadthEqual-weight versions or industry ETFs inside the leading sector. Leadership carried by two giants is fragile.
- Rank changesWhich sectors moved up or down the table this week. Rotation is the change, not the level.
Read · seeing it in the market
04How professionals read it
Professionals read the table top-down. The top three and bottom three over one month give the tone; the one-week column shows whether the tone is being confirmed or challenged; the three-month column shows whether the current order is new or established. Three columns, one glance.
They read rotation as healthy when it happens within the cyclical group — technology pausing while industrials lead — and as a tone change when it crosses the cyclical/defensive line. Money moving from growth to defensives is a different market; money moving from growth to industrials is the same market with a new leader.
They hold the reading lightly at turning points. The first week of a rotation looks like noise; the third week looks like a trend. Confirmation takes time, so an early reading is kept as a question rather than ignored.
And they always ask who is carrying the leader. A leading sector with narrow internal breadth can reverse in days; one with broad participation usually persists.
05What strength looks like
Healthy leadership looks like several cyclical sectors above their averages, the leader broad inside, and rotation passing the baton among cyclicals without the index breaking. Defensives lag — which is what they should do in a confident market.
Illustrative. The leading sector (gold) and the lagging sector (grey) against SPY (navy).
Source: illustrative teaching data — not market data
06What weakness looks like
A tone change looks like the table inverting: the leaders of the last three months sliding down the one-week column while defensives climb, the number of sectors above their averages falling, and the index going sideways or lower as money crosses from cyclical to defensive.
Illustrative. After the midpoint the old leader (gold) fades and the old laggard (grey) takes over while SPY (navy) flattens.
Source: illustrative teaching data — not market data
07What a divergence looks like
The leadership divergence to watch: the index at highs while the count of sectors above their 50-day averages falls and the table is topped by one group. Narrow sector leadership under a new high is fragility made visible in eleven lines.
Leaders → tone
- Technology, discretionary, communication → growth / risk-on
- Financials, industrials, materials → reflation / economic confidence
- Energy → inflation / supply
- Utilities, staples, healthcare → caution / rates relief
Checks before concluding
- Is the leader broad inside, or two giants?
- Do one-week and one-month columns agree?
- How many sectors are above their 50-day?
- Did the rotation cross the cyclical / defensive line?
What the order usually means.
Interpret · what it means for you
08What it means for an investor
For an investor the sector table explains what an index fund is actually exposed to and why its returns feel the way they do. By the time a leader is obvious, much of its move may be done — one reason many investors hold several sectors. Reading the table is for understanding, not for timing.
09What it means for a trader
For a trader the table is the map of where to look. Stocks in play cluster in leading sectors, where breakouts tend to have the crowd behind them. A rotation in progress is both a warning (yesterday's leaders are losing their tide) and a prompt to study the new leader's early names. The Advanced program opens every morning with this table.
10What it cannot tell you
- Leadership does not say how long it lasts; rotations can take weeks or a day.
- A sector's rank can be driven by two giants; internal breadth decides whether it means anything.
- Defensive leadership is a tone, not a forecast of a decline.
- Sector classifications are blunt and occasionally re-drawn; long comparisons can mislead.
Apply · the market right now
11What is happening right now
MAAL TRADING ACADEMY market note
No dated note has been published for this topic yet. We only publish current-market commentary written and dated by the academy — nothing auto-generated.
Data · previous close
Live levels for XLK, XLY, XLC, XLF, XLI, XLB, XLE, XLU, XLP, XLV, XLRE appear here once the licensed market-data feed is connected. We do not show unlicensed or made-up numbers.
How to check this yourself today
- Rank the eleven sector ETFs by 1-week, 1-month and 3-month returns.
- Count how many are above their 50-day average.
- Ask whether the top three are cyclical or defensive, and whether that changed this week.
- For the leader, check an equal-weight version or its main industry ETF.
12Visual market example
Rotation in one picture: a sector leads for months, then fades as a former laggard takes over, while the index goes sideways. The index reading is 'nothing happened'. The sector reading is 'the market changed its mind about what it wants to own' — which is the difference between a flat month and a new regime.
Illustrative. Same index, new leader.
Source: illustrative teaching data — not market data
Review · practise, keep, connect
13Test your understanding
Read the chart the way you would before a trade. Pick the answer, then read why.
1Three-month leaders: Technology, Discretionary, Communication. One-week leaders: Utilities, Staples, Healthcare. Sectors above their 50-day: fell from 9 to 5. What is happening?
Illustrative.
Source: illustrative teaching data — not market data
14Key takeaways
- The sector ranking is the fastest read on the market's character. The order is the message.
- Read three horizons: one week for today's money, one month for tone, three months for trend.
- Rotation within cyclicals is healthy; rotation across the cyclical / defensive line is a tone change.
- Check the leader's internal breadth before trusting it.
- Count the sectors above their 50-day averages — it is breadth at the sector level.
16Learn it in class
Advanced Program · Stage 1 · Finding Stocks in Play
The Advanced morning begins with the sector table — ranked, counted, and checked for rotation — before a single stock is considered.