
Understand · what it is and why it exists
01What it is
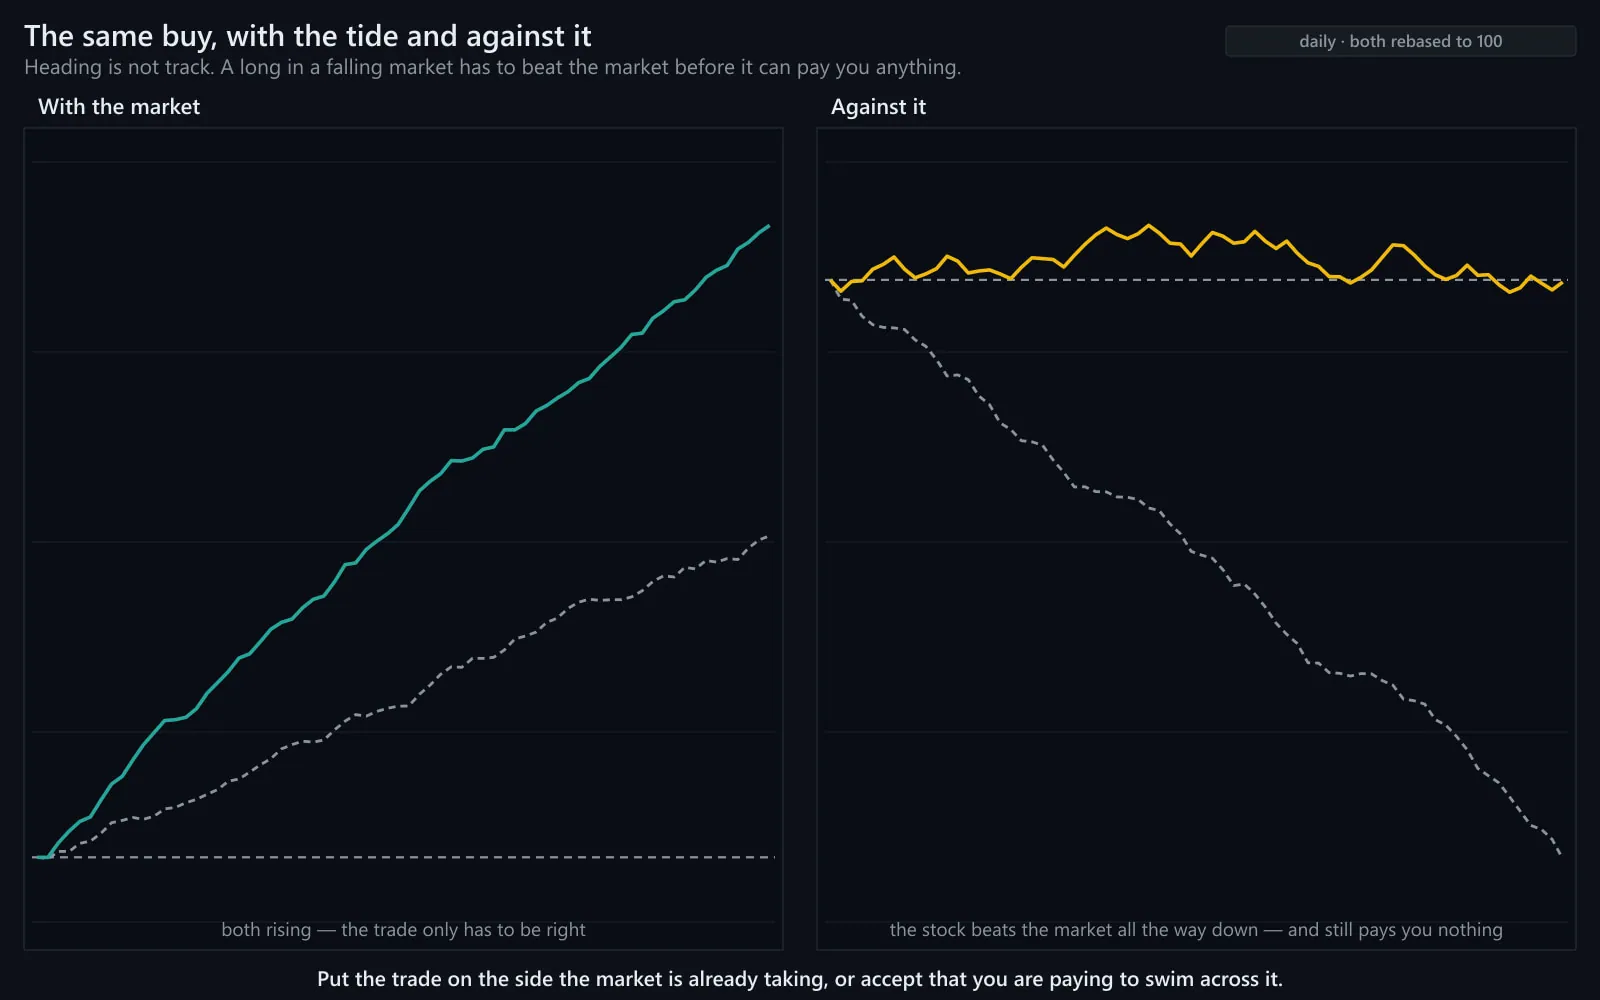
Every stock at every moment is doing one of three things relative to its market: moving with it (same direction, roughly proportional), moving against it (opposite direction), or ignoring it (trending on its own while the index chops). Which one it is doing changes what a setup in that stock means and how much to trust it.
'With the market' is the default and the most straightforward to read: the tide is helping. 'Against the market' is the rarest and the most informative: something stock-specific is overpowering the tide. 'Ignoring the market' is the signature of a name with its own catalyst — and the classic profile of a stock in play.
This lesson is where the three earlier ideas — relative strength, correlation, leadership — become a single pre-trade check. It takes ten seconds once the habit is formed, and it is a check that is easy to skip.
02Why it exists
The check exists because most of a stock's daily move is the market's move. A trader who buys a breakout without knowing what the index is doing is taking a position in the index without meaning to. When the index reverses, the 'stock trade' reverses with it, for reasons that had nothing to do with the stock.
It also exists because the exceptions carry the most information. A stock that rises while the index falls is being bought by someone who does not care about the tide. That is information about demand, and demand is what sustains a move after the initial burst.
03How it is measured or observed
The check is a combination of readings you already have, taken together on one screen:
- OverlayThe stock and its index (SPY or QQQ) on the same intraday chart. Same turns = with. Opposite turns = against. No shared turns = ignoring.
- VWAP on bothStock above its VWAP while the index is below its own = strength against the tide. Both above = with. Stock below while index above = weakness against the tide.
- Relative strength lineStock ÷ index, intraday. Rising while the index falls is the clearest 'against' reading.
- Sector contextIs the stock's sector leading or lagging today? A stock moving with a leading sector has two tides behind it; one moving against a lagging sector is fighting two.
- CatalystDoes the stock have its own reason — earnings, news, a level — to move independently? 'Ignoring the market' without a reason is suspicious.
- BetaHow much the stock normally moves per unit of index move. 'With the market' for a 2-beta name means twice the index; less than that is quiet relative weakness.
Read · seeing it in the market
04How professionals read it
Professionals run the check in this order: what is the index doing, what is the sector doing, what is the stock doing relative to both. Three glances. If all three agree and the setup is in that direction, the setup has the whole market behind it and keeps its planned size. If the stock is fighting the index, the setup needs a reason — a catalyst — and gets smaller size or no trade.
They treat 'against the market' as a flag, not a signal. A stock rallying while the index falls is either a leader being accumulated or a short squeeze that tends to end when the index bounces. The catalyst and the volume decide which.
They watch for the moment the relationship changes. A stock that was moving with the index and suddenly stops following it on a pullback — holds its level while the index makes a new low — has just told you something. That moment is one the Advanced program studies closely.
And they rarely trade a stock against a strongly trending index without a specific reason. On a trend day, 'against' is mostly noise and it is expensive noise.
05What strength looks like
With the market, on a trend day: the stock makes every turn the index makes, larger, holds above its VWAP while the index holds above its own, and extends into the close with it. The setup and the tide agree. This is the most straightforward alignment to read — and the one a range-day mindset fights by fading it.
Illustrative. The stock (gold) follows the index (navy) turn for turn with more amplitude — two tides in the same direction.
Source: illustrative teaching data — not market data
06What weakness looks like
Against the market: the index trends up and the stock drifts down through it, failing at every bounce the index makes. Someone is selling this name regardless of the tide. Some traders would watch it as a short candidate if the index pauses; as a long it has the tide against it, however cheap it looks.
Illustrative. The index (navy) rises; the stock (gold) falls — relative weakness against a helping tide.
Source: illustrative teaching data — not market data
07What a divergence looks like
Ignoring the market: the index chops in a range all day and the stock trends steadily higher through it, barely noticing the index's swings. This is the profile of a stock in play — a name with its own catalyst and its own buyers. It is often the cleanest of the three states to read, because the index's noise matters less.
Illustrative. The index (navy) ranges; the stock (gold) trends on its own — a stock in play.
Source: illustrative teaching data — not market data
Interpret · what it means for you
08What it means for an investor
For an investor the question is the long-horizon version: over quarters, is this holding moving with the market, ahead of it, or behind it? A stock that has fallen while the market rose for a year is not automatically cheap; it has been telling you, for a year, that something may be wrong. The check is a reason to re-read the business, not a reason to average down.
09What it means for a trader
For a trader this is the pre-trade check, in full: index direction, sector direction, stock relative to both, catalyst, beta. With → the planned size stands if the setup is in the tide's direction. Ignoring, with a catalyst → read as a stock in play, sized on its own range. Against, without a catalyst → no trade. The Advanced rule applies: no valid setup, no trade — and a setup against the tide without a reason is not valid.
10What it cannot tell you
- 'With the market' does not make a setup good; it makes the tide helpful. The setup still has to be there.
- 'Against the market' is a flag, not a signal. It needs a catalyst and volume to mean accumulation rather than a squeeze.
- Relationships change within the day. The check is repeated, not done once.
- Beta is an average. A stock can move with the index by more or less than usual on any given day.
Apply · the market right now
11What is happening right now
MAAL TRADING ACADEMY market note
No dated note has been published for this topic yet. We only publish current-market commentary written and dated by the academy — nothing auto-generated.
Data · previous close
Live levels for SPY, QQQ appear here once the licensed market-data feed is connected. We do not show unlicensed or made-up numbers.
How to check this yourself today
- Put SPY (or QQQ) and one stock you follow on the same intraday chart with VWAP on both.
- Ask: same turns, opposite turns, or no shared turns?
- Check the stock's sector ETF for the day — leading or lagging?
- Ask whether the stock has its own catalyst today. If it is ignoring the market without one, be suspicious.
12Visual market example
Three states on one page: a stock moving with a trending index, a stock fighting it, and a stock ignoring a ranging index. The first has the tide behind it and keeps its planned size. The second is left alone unless there is a specific reason. The third is the stock in play — sized on its own range, traded on its own levels, with the index's chop ignored.
Worth studying
- With the market, setup in the tide's direction → planned size stands
- Ignoring the market with a catalyst and volume → stock-in-play, sized on its own range
- Holds its level while the index makes a new low → a moment the class studies closely
Leave it
- Against a trending index with no catalyst → no trade
- Weak while its sector leads → the tide is against a long, whatever the pattern
- Rallying against the index on thin volume → likely a squeeze
Index · sector · stock — three glances before Buy.
Review · practise, keep, connect
13Test your understanding
Read the chart the way you would before a trade. Pick the answer, then read why.
1SPY is trending up all morning. Your stock is below its VWAP, failing at each bounce, while its sector ETF is green. A textbook bull-flag pattern appears on its chart. Trade it?
Illustrative.
Source: illustrative teaching data — not market data
14Key takeaways
- Every stock is with the market, against it, or ignoring it. Know which before Buy.
- Three glances: index, sector, stock relative to both. Then catalyst and beta.
- With the tide and a setup → planned size stands. Ignoring with a catalyst → stock in play. Against without a reason → no trade.
- 'Against the market' is a flag that needs volume and a catalyst to mean accumulation.
- The check is repeated through the day; relationships change.
16Learn it in class
Advanced Program · Stage 4 · Trading Ranges · Stage 7 · Trading the Closing Bell
Before any simulated trade in the Advanced program: Symbol → Setup → Entry → Stop → Position size → Target — and the first line of 'Setup' is whether the stock is moving with or against the market.