
Understand · what it is and why it exists
01What it is
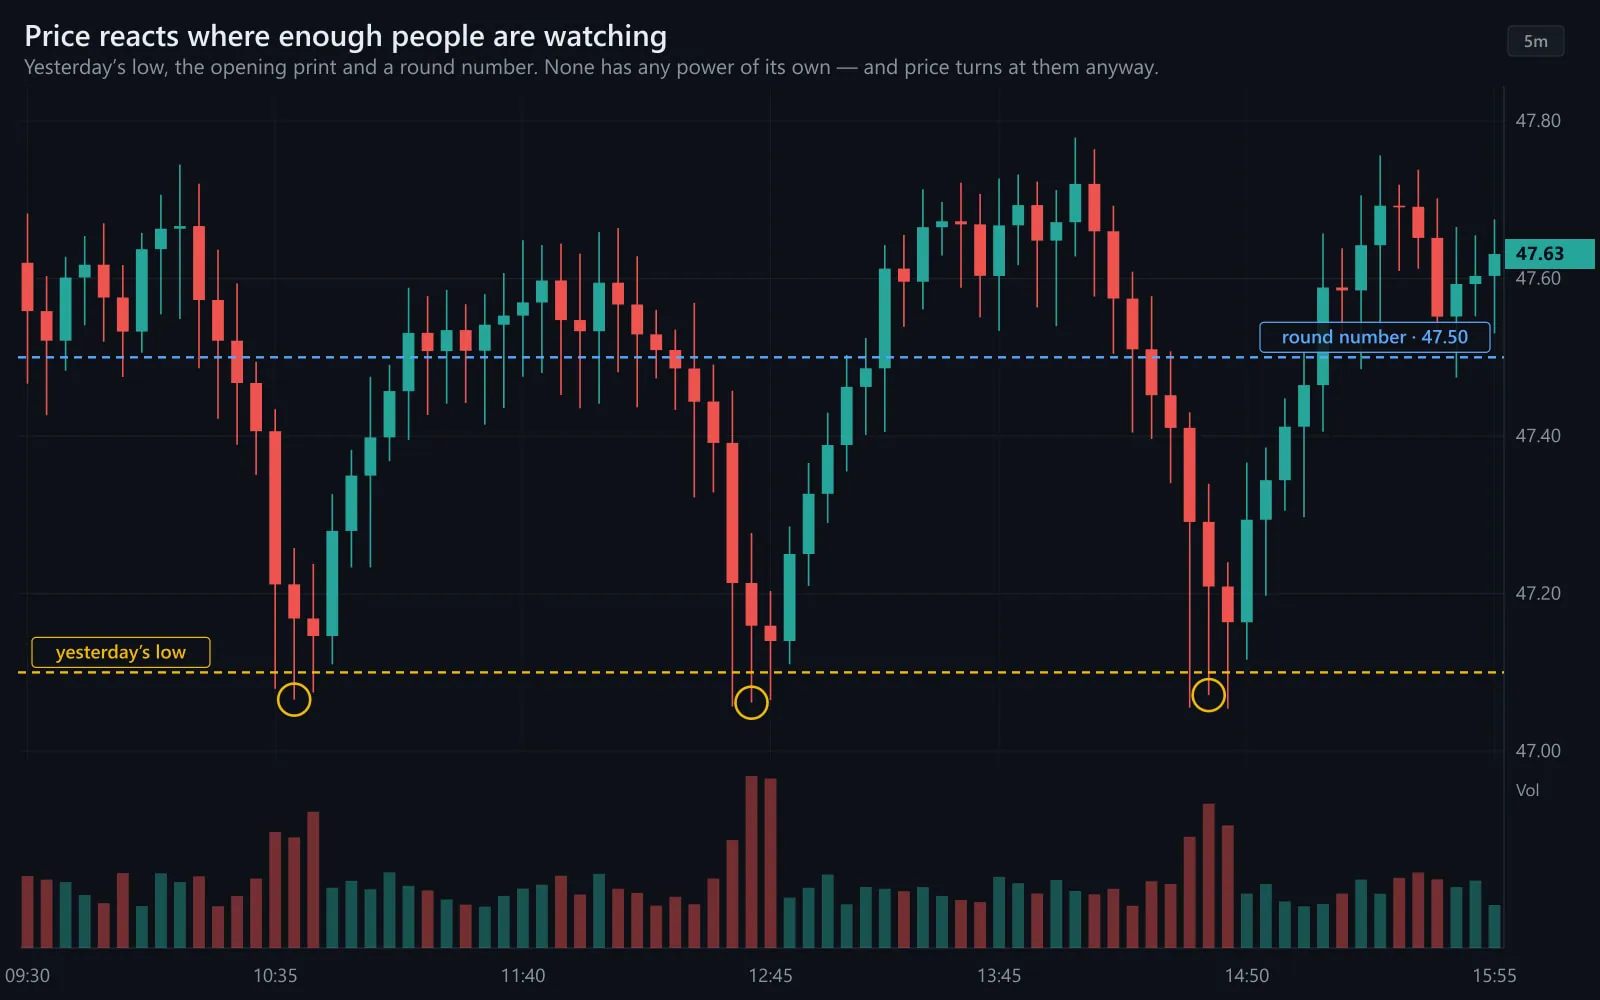
A level is a price where enough participants are paying attention that price tends to react when it gets there. Yesterday's high and low. Today's open. The volume-weighted average price. The 50-day and 200-day moving averages. A round number. The high of the last rally, the low of the last sell-off.
Levels are not lines drawn by the market; they are places where memory and orders concentrate. People who bought at yesterday's high remember it. Funds that benchmark to VWAP defend it. Stops sit just beyond obvious lows. When price returns to one of those places, the behaviour of the crowd becomes briefly predictable — not in direction, but in attention.
That is what a level is: a price where something is likely to happen, and where the way it happens tells you who is in control.
02Why it exists
Levels exist because participants anchor. A trader who sold at a high wants to sell there again; one who bought at a low wants to buy there again; everyone who was stopped out at a level remembers it. Orders accumulate where memories are, and orders are what move price.
Some levels are structural rather than psychological. VWAP matters because institutions measure their execution against it. Moving averages matter because so many systems and funds use them. Round numbers matter because humans place orders at them. The reason differs; the effect — concentrated attention — is the same.
03How it is measured or observed
The levels professionals mark before the open, roughly in order of importance for a day trader:
- Prior day high, low and closeThe most watched levels every day. The first test of the prior close is the opening's key moment; the prior high and low are the day's first targets and first failures.
- Opening rangeThe high and low of the first 15–30 minutes. Breaking out and holding, or breaking and re-entering, is the first label of the day.
- VWAPVolume-weighted average price, reset daily. Where the average participant stands. Above it buyers are winning on average; below it sellers are. Institutions defend it.
- Pre-market high and lowWhere overnight trading found its edges. Often the first levels tested at the open.
- Moving averages (20, 50, 200-day)Slow levels for the daily chart. The 200-day is the most watched dividing line between 'uptrend' and 'downtrend' for the broad market.
- Swing highs and lows, round numbersThe last meaningful peak and trough on the chart, and prices like 500 or 100 where orders cluster.
Read · seeing it in the market
04How professionals read it
Professionals mark levels before the open and then watch how price behaves at them — not whether it gets there. A level reached and rejected sharply says the other side was waiting. A level reached, broken and held says one side gave up. A level broken and immediately reclaimed says the break was a trap. The reaction is the information; the level is just where to look for it.
They also rank levels. Yesterday's high with the opening range just below it is a cluster; two levels close together are stronger than one. A level with a lot of volume traded at it (a high-volume node) is stronger than one crossed on thin trade.
They use VWAP as the day's referee. Above VWAP the bias leans up and many watch pullbacks toward it; below it the bias leans down and many watch bounces. Repeated crossing means no one is in charge — a range-day signature.
And they know what levels are not. A level is not a prediction that price will reverse. It is a place where a decision gets made, and the decision can go either way. What matters is the reaction, not the line.
05What strength looks like
A level doing its job: price approaches yesterday's low, the selling dries up, buyers step in, and price rejects the level sharply on volume. Support held — which says the participants who defended it last time are still there.
Illustrative. Price (navy) tests a prior low (gold line) repeatedly and is rejected each time — buyers are defending it.
Source: illustrative teaching data — not market data
06What weakness looks like
A level failing: price pushes through yesterday's high, pulls back to it, and holds above. The level flips — what was resistance is now support. A clean break-and-hold on expanding volume is one of the clearest one-sided statements the market makes.
Illustrative. Price (navy) breaks a prior high (gold line), retests it from above, holds, and continues — resistance has become support.
Source: illustrative teaching data — not market data
07What a divergence looks like
The level trap: price breaks an obvious level by a few cents, triggers the stops sitting beyond it, and immediately reverses back through. Everyone who chased the break is now wrong. Failed breaks at obvious levels are a signature of range days, and some traders study the failure itself rather than the break.
Says one side is in control
- Sharp rejection on volume
- Break, shallow retest, hold
- Level flips (resistance becomes support)
- Price stays on one side of VWAP
Says no one is in control
- Break by a few cents, then reversal (trap)
- Repeated crossing of the level
- VWAP crossed again and again
- Volume spikes at the level, then dies
The level is where to look; the behaviour is what you read.
Interpret · what it means for you
08What it means for an investor
For an investor levels are mostly execution aids: a limit order near a well-defended level tends to fill better than a market order. The 200-day average is the one level worth knowing on the daily chart, not as a signal but as the line most of the market uses to describe the trend.
09What it means for a trader
For a trader levels are where the plan lives. The Advanced program's setup framework — Symbol → Setup → Entry → Stop → Position size → Target — is written in levels: entry at the break or the retest, stop just beyond where the setup is invalid, target at the next level. 'No valid setup, no trade' means 'no level, no trade'.
10What it cannot tell you
- A level does not predict direction. It predicts attention. The decision at the level can go either way.
- Obvious levels attract traps. The more people see a level, the more likely a break of it is a stop hunt.
- Levels lose meaning with time and volume; a level from three weeks ago matters less than yesterday's.
- Drawing more lines does not help. A chart with fifteen levels has none.
Apply · the market right now
11What is happening right now
MAAL TRADING ACADEMY market note
No dated note has been published for this topic yet. We only publish current-market commentary written and dated by the academy — nothing auto-generated.
Data · previous close
Live levels for SPY, QQQ appear here once the licensed market-data feed is connected. We do not show unlicensed or made-up numbers.
How to check this yourself today
- Before the open, write down SPY's prior high, low and close, and the pre-market high and low.
- Mark the 20-, 50- and 200-day averages on the daily chart — where is price relative to each?
- Once the session starts, add the opening range and VWAP.
- Watch the first test of each level for its reaction: reject, break-and-hold, or break-and-fail.
12Visual market example
A level's life in one session: price tests yesterday's high twice and fails, then breaks it on volume, comes back to retest it from above, holds, and runs. Before the break, the level was resistance; after the retest it was support. The information was never at the line — it was in what price did when it got there.
Illustrative. The same level (gold) plays two roles in one session.
Source: illustrative teaching data — not market data
Review · practise, keep, connect
13Test your understanding
Read the chart the way you would before a trade. Pick the answer, then read why.
1Price breaks above yesterday's high by a few cents on thin volume, then falls back below it within two minutes. Which read is correct?
Illustrative.
Source: illustrative teaching data — not market data
14Key takeaways
- A level is a price where attention and orders concentrate — not a wall and not a prediction.
- Mark a few: prior high/low/close, opening range, VWAP, the major averages. Not fifteen.
- Read the reaction at the level: rejection, break-and-hold, or trap. That is the information.
- VWAP is the day's referee; repeated crossing means no one is in charge.
- The plan is written in levels: entry, stop and target. No level, no trade.
16Learn it in class
Advanced Program · Stage 4 · Trading Ranges · Stage 5 · Executing Breakouts
Advanced Day 1 afternoon: Range high → Range low → Entry → Stop → Target, then live range execution in the final market hour. Every plan is a set of levels.