
Understand · what it is and why it exists
01What it is
Relative strength is a stock's performance compared with a benchmark — usually SPY for the broad market, QQQ for growth names, or its sector ETF. A stock with relative strength is doing better than its benchmark over the period you are measuring; one with relative weakness is doing worse.
It is relative, not absolute. A stock down 1% on a day the market is down 3% has relative strength. A stock up 1% on a day the market is up 4% has relative weakness. The comparison strips out the market's move and leaves only the part that belongs to the stock.
And it is not RSI. The Relative Strength Index is a momentum oscillator that compares a stock's recent gains with its recent losses — a stock against itself. Relative strength compares a stock with something else. Same initials, different ideas; the confusion leads to wrong readings.
02Why it exists
Most stocks move with the market most of the time. That shared component is the tide. Relative strength exists to find what is left after the tide is removed: the stocks that are being accumulated harder than the market, and those being sold harder. Those residuals are where information about individual businesses and positioning shows up.
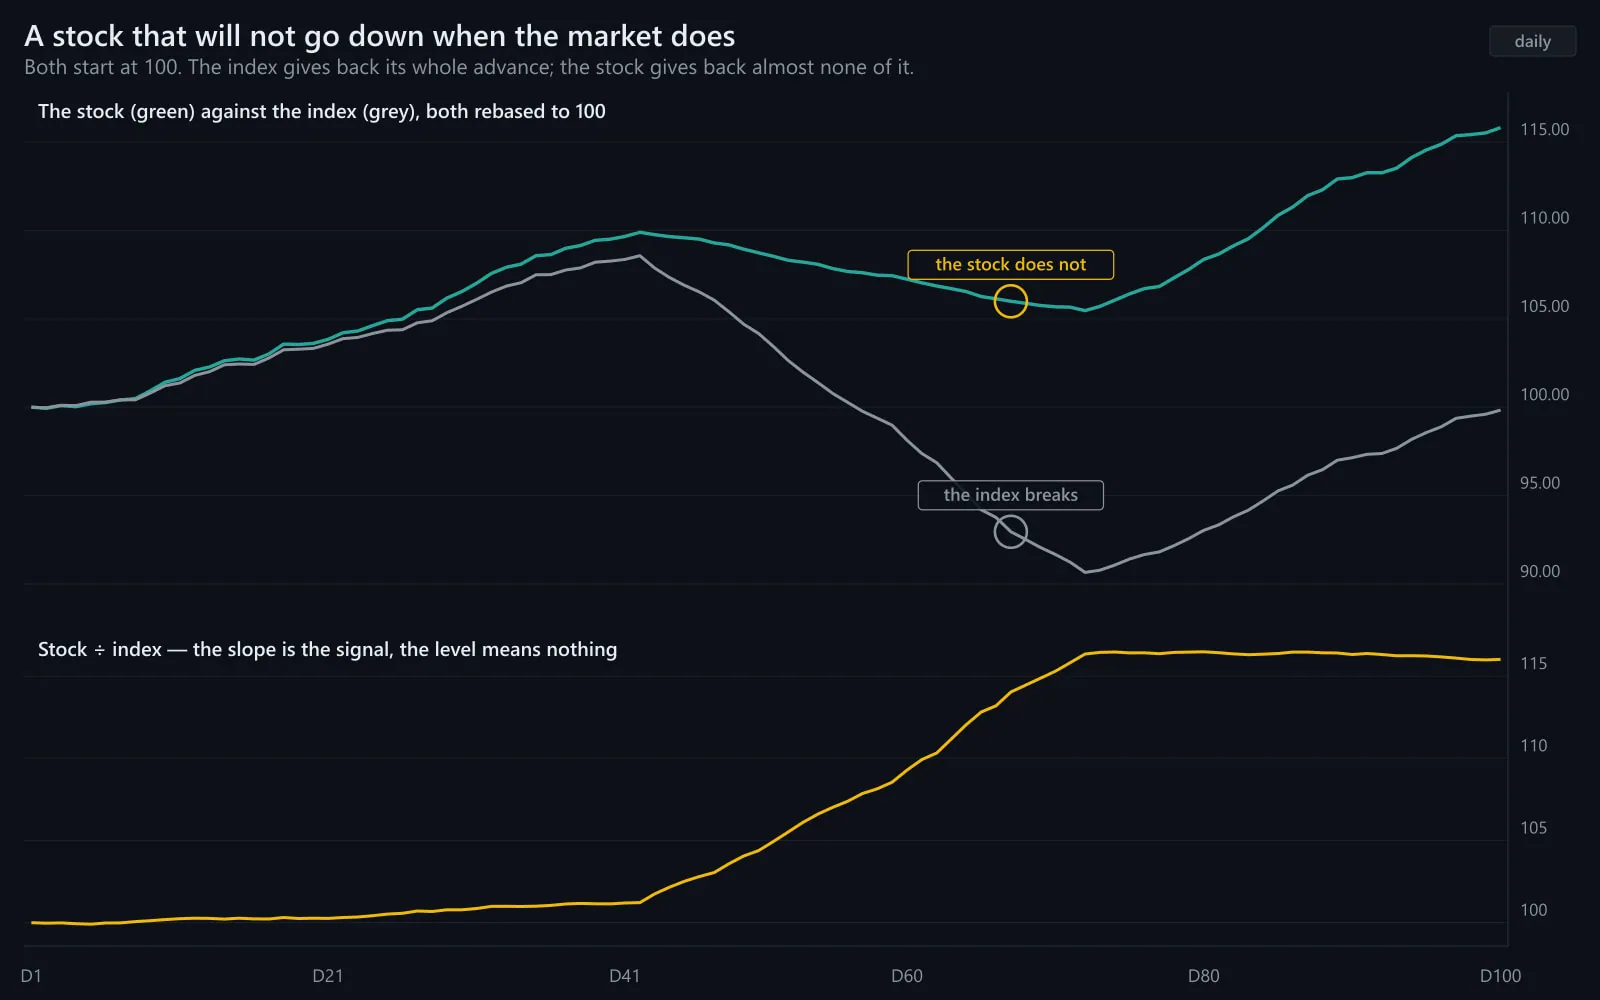
It matters most at the edges. A stock that refuses to fall in a sell-off is one where buyers are absorbing supply; when the market turns, those names tend to lead. A stock that cannot rally in a strong market is one where sellers are waiting; when the market weakens, those names tend to fall first.
03How it is measured or observed
Relative strength is measured by comparison, over a chosen period, against a chosen benchmark:
- The ratio lineStock price divided by benchmark price, plotted over time. Rising = outperforming. The slope and direction matter; the level is meaningless on its own.
- Return differenceStock return minus benchmark return over a day, a week, a month. +3% minus +1% is two points of relative strength.
- Behaviour on down daysDoes the stock fall less than the market, or not at all, when the market sells off? This is the most informative test.
- Behaviour on up daysDoes the stock rally less than the market, or not at all, when the market rises? The mirror test.
- Choice of benchmarkSPY for most stocks; QQQ for growth and technology; the sector ETF for a sector-driven name. The wrong benchmark produces confident, wrong readings.
- Time frameIntraday (against the index from the open), daily, weekly. A stock can be strong on the day and weak on the month. Name the period.
Read · seeing it in the market
04How professionals read it
Professionals read relative strength as a filter, not a signal. On a day they want to be long, they look for stocks that were already outperforming — the ones holding up on the last pullback, the ones making highs before the index did. The filter narrows a thousand stocks to twenty worth studying.
They read it most carefully when the market is moving against their idea. A stock that holds its morning high while SPY loses VWAP is showing relative strength in real time; it is telling them buyers are present regardless of the index. That is a candidate for the moment the index turns. A stock that makes new lows while SPY bounces is the opposite.
They always name the benchmark and the period. 'Strong against QQQ this week' is a reading. 'Strong' is not.
And they do not confuse it with momentum. A stock can have relative strength while falling (it fell less) and relative weakness while rising (it rose less). The reading is about the comparison, and only the comparison.
05What strength looks like
Relative strength looks like a stock that keeps making progress when the benchmark stalls, and holds when the benchmark falls. The ratio line rises steadily. On the day's chart, the stock holds above its VWAP while the index loses its own.
Illustrative. The stock (gold) pulls away from SPY (navy) after the midpoint — it is being accumulated harder than the market.
Source: illustrative teaching data — not market data
06What weakness looks like
Relative weakness looks like a stock that lags every rally and leads every decline. The ratio line falls. On the day's chart, the stock loses its VWAP while the index holds its own. It may still be 'up' — it is simply up less, or down more, than everything around it.
Illustrative. The stock (gold) falls behind SPY (navy) — sellers are present regardless of the market.
Source: illustrative teaching data — not market data
07What a divergence looks like
The most informative relative-strength reading is the one that appears during market weakness: the index falls steadily and a stock simply refuses to, trading sideways through the sell-off. That divergence — stock flat, market down — is where leaders for the next rally are usually found. It is the subject of its own lesson in this cluster.
Illustrative. SPY (navy) declines; the stock (gold) holds flat — buyers are absorbing the sell-off.
Source: illustrative teaching data — not market data
Interpret · what it means for you
08What it means for an investor
For an investor relative strength is a long-horizon question: is this company gaining or losing ground against the market over quarters and years? A holding that has lagged the index for three years is a decision to revisit; one that has led is a decision to understand. Relative strength does not say buy or sell; it says look.
09What it means for a trader
For a trader it is the daily filter. The Advanced program's first stage — finding stocks in play — ranks candidates by relative strength against SPY and QQQ from the open: which names are green while the index is red, which are holding VWAP when the index is not. Those names are studied first; the rest are watched.
It is also an exit tell. A position that loses relative strength — starts lagging the index after leading it — can show the reason for the trade fading before the price does.
10What it cannot tell you
- Relative strength is not momentum. A stock can have it while falling.
- It is not RSI. The indicator compares a stock with itself; this compares it with a benchmark.
- It does not predict how long outperformance lasts. Leaders rotate.
- Measured against the wrong benchmark, it is noise. A bank against QQQ tells you nothing.
- A single day's relative move can be news-driven and meaningless. Confirm over several sessions.
Apply · the market right now
11What is happening right now
MAAL TRADING ACADEMY market note
No dated note has been published for this topic yet. We only publish current-market commentary written and dated by the academy — nothing auto-generated.
Data · previous close
Live levels for SPY, QQQ appear here once the licensed market-data feed is connected. We do not show unlicensed or made-up numbers.
How to check this yourself today
- Pick three stocks you follow. Chart each divided by SPY (or QQQ for growth names) over three months. Which ratios are rising?
- On the last market down day, which of them fell less than the index — or not at all?
- Intraday: which are above their VWAP while SPY is below its own?
- Name the benchmark and period for every reading you write down.
12Visual market example
The full picture in one chart: a strong stock, a weak stock, and the index. Early on all three move together — that is the tide. Then the strong name pulls away and the weak one falls behind while the index goes sideways. A trader reading only the index sees nothing to do. A trader reading relative strength has two names worth studying — one strong, one weak.
Illustrative. Remove the index's move and what remains is the stock's own story.
Source: illustrative teaching data — not market data
Review · practise, keep, connect
13Test your understanding
Read the chart the way you would before a trade. Pick the answer, then read why.
1Market down 2.5% on the day. Stock A −0.3%. Stock B −4%. Stock C +0.1%. Which show relative strength?
Illustrative.
Source: illustrative teaching data — not market data
2A stock's RSI reads 78. A colleague says 'it has strong relative strength'. Are they right?
RSI (indicator)
- Compares recent gains with recent losses
- A stock against itself
- Reads 0–100; 'overbought' above 70
Relative strength
- Compares a stock with a benchmark
- A stock against the market or sector
- Read as a ratio line or return difference
14Key takeaways
- Relative strength is performance against a benchmark, not against zero. A falling stock can have it.
- It is not RSI. RSI compares a stock with itself.
- Always name the benchmark (SPY, QQQ, sector) and the period.
- The most informative reading is behaviour on the market's down days.
- Use it as a filter for what to study and a tell for when a position's reason is fading — never as a signal on its own.
16Learn it in class
Advanced Program · Stage 1 · Finding Stocks in Play
Advanced Day 1: the watchlist is ranked by relative strength against SPY and QQQ from the open — Symbol → Catalyst → Volume → Price level → Reason it's in play.