
Understand · what it is and why it exists
01What it is
Volatility is the size of price movement over time. A stock that moves 0.5% on a typical day is low-volatility; one that moves 4% is high-volatility. Neither word says which direction — volatility is about the magnitude of the swings, up and down.
It is the market's uncertainty made visible. When participants broadly agree on what something is worth, prices drift. When they disagree, or when new information arrives faster than it can be digested, prices jump.
For anyone with money at risk, volatility is the single most practical number there is, because it sets how far a position can move against you in an ordinary day — before anything unusual happens.
02Why it exists
Prices move when the balance of buyers and sellers shifts. The more uncertain the future — an earnings report, a rate decision, a war, a product launch — the more that balance shifts, and the larger the moves. Volatility rises with uncertainty and falls as it resolves.
It also clusters. Volatile days tend to follow volatile days; calm days follow calm days. That is why measuring it is useful: the recent past is a reasonable guide to the size of the next few days' moves, even though it says nothing about their direction.
03How it is measured or observed
Volatility is measured backward (what prices did) and forward (what the options market expects). Both matter, and they often disagree:
- Daily rangeHigh minus low, usually expressed as a percentage of price. The simplest measure and the one a trader feels first.
- Average True Range (ATR)The average daily range over a window (often 14 days), including overnight gaps. A stock with an ATR of $3 typically travels about $3 from high to low in a day.
- Historical (realized) volatilityThe standard deviation of daily returns, annualized. 15% is a calm large-cap; 60% is a volatile growth stock.
- Implied volatilityThe volatility priced into options. It is the market's forecast of future movement, and it rises before known events such as earnings.
- The VIXAn index of implied volatility on the S&P 500 over the next 30 days. Readings in the teens are calm; the 30s are stressed; the 40s and above have accompanied crises.
- Bollinger Band widthHow far apart the bands around a moving average sit. Narrow bands mean contraction; wide bands mean expansion.
Read · seeing it in the market
04How professionals read it
Professionals read volatility first as a sizing input and only second as a market signal. Before anything else, it tells them how many shares they can hold for a given dollar risk: the wider the typical range, the smaller the position. That rule is older than any indicator.
As a market signal, they watch the regime and its changes. A market moving from calm to volatile usually does so abruptly, and the transition — a sudden expansion after weeks of contraction — is itself the information. Quiet markets store energy; the release is rarely polite.
They also compare implied with realized. When options price far more movement than is occurring, the market is braced for something; when realized movement exceeds what options priced, the market was caught off guard. Both conditions tend to resolve.
What they do not do is treat high volatility as 'bad' or low as 'good'. High volatility is expensive and dangerous for some strategies and exactly what others need. The question is whether your plan is built for the regime you are in.
05What strength looks like
A calm regime looks like small, overlapping daily bars, narrow bands, and a VIX drifting in the teens. Moves are gradual. Pullbacks are shallow. Trends, when they exist, are smooth.
For trend-following and longer-term positions this is a comfortable environment: stops can sit closer, positions can be larger for the same risk, and surprises are rarer. It is also the environment in which people forget what volatility feels like.
Illustrative. Small daily changes, a smooth drift — low realized volatility.
Source: illustrative teaching data — not market data
06What weakness looks like
A volatile regime looks like large bars in both directions, gaps at the open, and a VIX in the high 20s or above. A move that would have taken a month in a calm market happens in an afternoon and reverses the next morning.
Strategies built for calm markets break here: stops that were sensible are hit by noise; positions sized for a 1% day meet 4% days. The mistake is not being in a volatile market — it is not changing anything when the regime changed.
Illustrative. The same number of days; several times the movement. A stop placed for the calm regime would be hit by noise.
Source: illustrative teaching data — not market data
07What a divergence looks like
Volatility's version of divergence is the transition: contraction that precedes expansion, and expansion that exhausts into contraction. Watch for bars getting smaller and bands tightening for weeks — that is compression. The direction of the eventual release is unknown; its size is usually not.
The opposite transition matters too. After a violent expansion, the largest bars often come near the end, not the beginning, of a move. Expansion that stops expanding is frequently the first sign a panic is fading.
Contraction
- Daily ranges shrink week over week
- Bands tighten; ATR falls
- Volume often dries up
- Implied volatility drifts lower
- Energy is being stored
Expansion
- A large bar breaks the quiet, often with a gap
- ATR jumps; bands widen
- Volume surges
- Implied volatility spikes
- Energy is being released — direction decided by the break
Two halves of the same cycle.
Interpret · what it means for you
08What it means for an investor
For an owner with a multi-year horizon, volatility is the price of admission, not a problem to be solved. The historical return of broad indexes has come with regular 10–20% declines and occasional larger ones; how much volatility a holder can sit through is a question for their own plan, not something a chart answers.
It is also a behavioural hazard. High volatility is when most long-term plans get abandoned. Knowing the regime in advance — and deciding what you will do in it before it arrives — is most of the battle.
09What it means for a trader
For a trader, volatility sets position size. The rule taught in every MAAL TRADING ACADEMY class is to decide the dollar amount you are willing to lose first, then divide by the distance to your stop — and the distance to a sensible stop is a function of the stock's range. Double the ATR, halve the shares.
It also sets strategy. In range-bound, low-volatility sessions traders tend to favour patience and reversals at the extremes; in expanding, high-volatility sessions, going with the break and accepting wider stops. Applying either approach in the wrong regime is a common and costly mismatch.
10What it cannot tell you
- It cannot tell you direction. A volatile market can be volatile upward. Compression tells you a move is likely; it does not say which way.
- It cannot tell you when. Contraction can persist far longer than feels reasonable. The VIX can stay elevated for months.
- A high VIX is not automatically a buy, and a low VIX is not automatically a sell. Both readings have persisted through long moves in both directions.
- Implied volatility is a forecast made by people. It is frequently wrong in both directions — that is exactly why options are traded.
Apply · the market right now
11What is happening right now
MAAL TRADING ACADEMY market note
No dated note has been published for this topic yet. We only publish current-market commentary written and dated by the academy — nothing auto-generated.
Data · previous close
Live levels for SPY, QQQ appear here once the licensed market-data feed is connected. We do not show unlicensed or made-up numbers.
How to check this yourself today
- Look up the VIX level and compare it with its range over the last year. Teens = calm; 20s = elevated; 30s+ = stressed.
- On a chart of SPY, compare the last two weeks of daily ranges with the two weeks before. Are bars growing or shrinking?
- Check the 14-day ATR on a stock you follow, and recompute the share size a fixed dollar risk would allow.
- Look at the calendar: are there known events (Fed, CPI, major earnings) in the next five sessions? Implied volatility usually rises into them.
12Visual market example
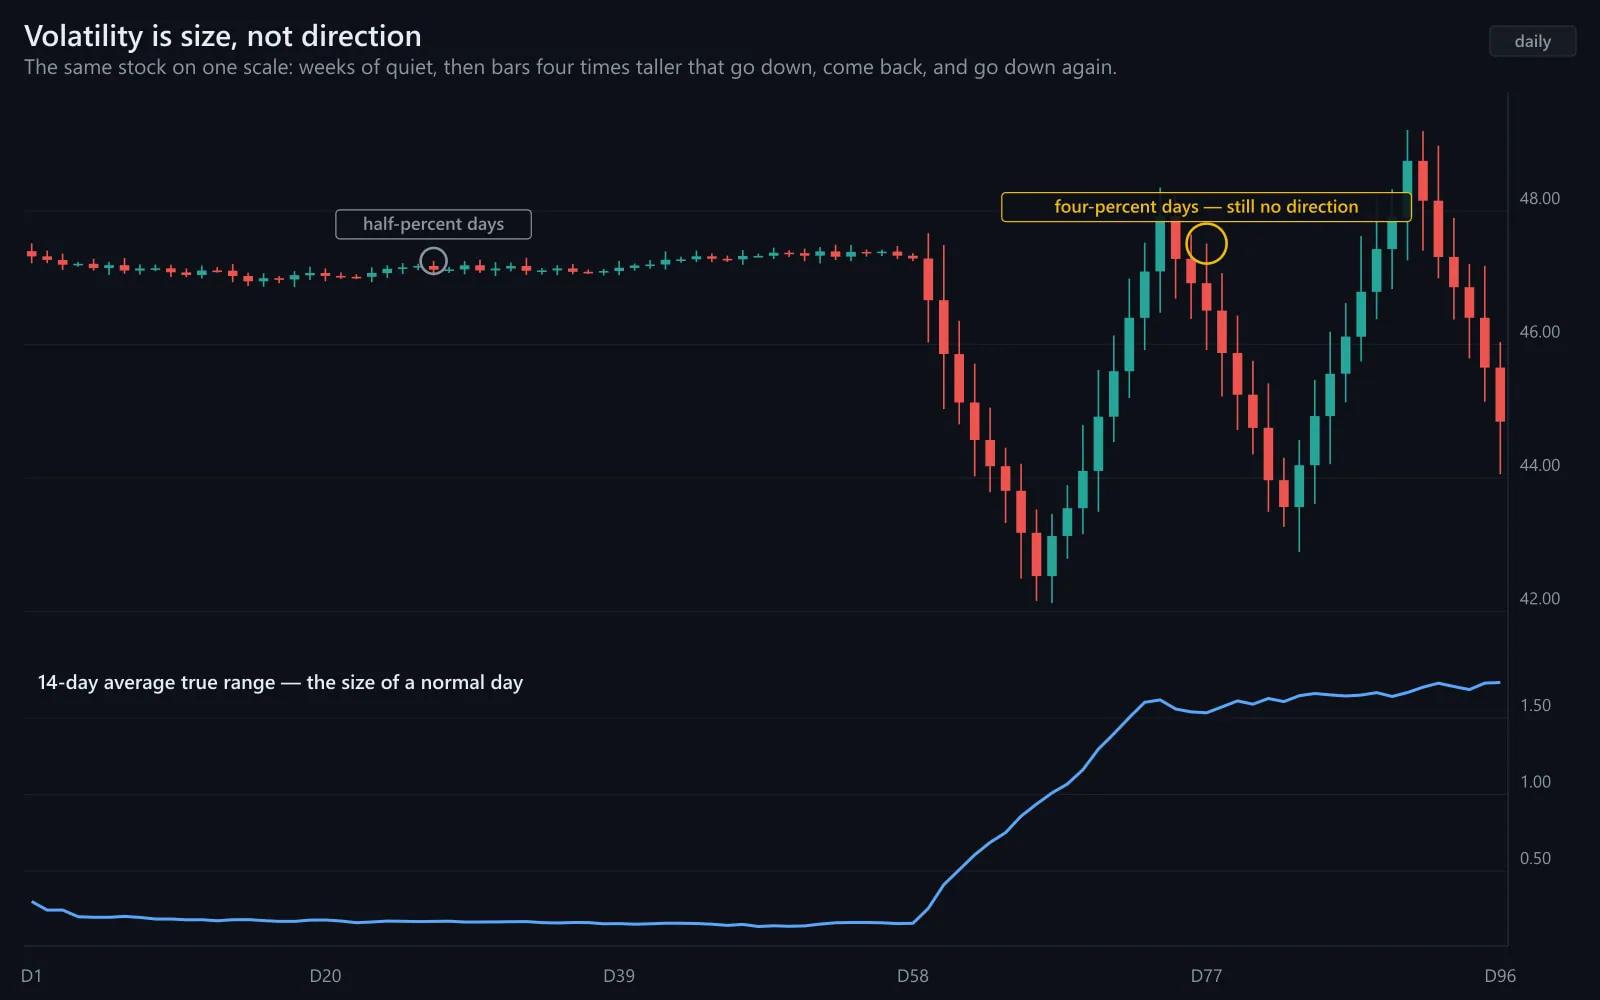
Here is the cycle in one picture. On the left, daily ranges shrink for weeks — the market is compressing. On the right, a single break starts the expansion, and every bar after it is larger than anything in the quiet period.
Nothing about the quiet period predicted the direction. Everything about it predicted the size.
Illustrative. Left: a compressing range. Right: the release. Direction was unknown in advance; magnitude was not.
Source: illustrative teaching data — not market data
Review · practise, keep, connect
13Test your understanding
Read the chart the way you would before a trade. Pick the answer, then read why.
1Two stocks, same price, same dollar risk per trade. Which one calls for fewer shares?
Illustrative.
Source: illustrative teaching data — not market data
2Daily ranges have shrunk for three straight weeks. What does that tell you?
Illustrative.
Source: illustrative teaching data — not market data
14Key takeaways
- Volatility is the size of movement, not its direction.
- Measure it backward (range, ATR, realized) and forward (implied, VIX). They disagree often, and the disagreement is information.
- Size the position from the range: decide the dollar risk, then divide by a stop distance that respects the ATR.
- Regimes change abruptly. Contraction stores energy; expansion releases it. Plan for the regime you are in, not the one you prefer.
- High or low volatility is neither good nor bad. Mismatched strategy is.
16Learn it in class
Beginner Program · Stage 5 · Capital Protection
Position sizing from the stock's range is taught in the Beginner program — before you ever place a simulated trade with size.