
Understand · what it is and why it exists
01What it is
Correlation is the degree to which two things move together. A stock with high correlation to SPY rises when SPY rises and falls when SPY falls, most of the time; one with low correlation goes its own way. Most large stocks are strongly correlated with their index on most days — the market is the tide, and the tide moves everything.
The practical question is not 'is my stock correlated?' (it almost certainly is) but 'how much of today's move is the index, and how much is the stock?' A semiconductor stock up 2% on a day QQQ is up 2% has told you nothing about itself. The same stock up 2% on a day QQQ is flat has.
Correlation also has a magnitude dimension: a stock can move in the same direction as the index but by more (a high-beta name) or by less (a low-beta name). A stock that typically moves 1.5 times the index is a leveraged bet on the index whether you intended it or not.
02Why it exists
Correlation exists because the forces that move the market — rates, growth expectations, risk appetite, flows into and out of index funds — move every stock in it. When an index fund buys, it buys every member; when fear rises, every member is sold. The shared component is large, and it is larger in stressed markets, when everything sells together.
It varies by stock and by regime. Growth names are tightly coupled to QQQ; banks to the financial sector and rates; an oil producer to crude more than to SPY. And in a panic, correlations rise toward one — diversification across stocks stops working at exactly the moment people want it to.
03How it is measured or observed
Correlation is measured statistically, but traders read it visually:
- Correlation coefficientFrom −1 to +1 over a period, computed from daily returns. Most large caps sit between +0.5 and +0.9 against SPY. Rough, backward-looking, and still useful.
- BetaHow much the stock moves for a given index move. Beta 1.5 means 1.5% for every 1% in the index, on average. Beta is magnitude; correlation is consistency.
- Overlay chartThe stock and the index on the same chart, intraday or daily. Coupled = the shapes match; decoupled = they don't. The quickest read there is.
- Choice of indexA growth stock against QQQ; an industrial against SPY; a regional bank against IWM or the bank ETF. The wrong pairing shows false decoupling.
- Sector correlationMany stocks correlate more with their sector ETF than with the broad index. The sector is often the better tide to measure against.
- Regime checkCorrelations rise in sell-offs and fall in calm, stock-specific markets. The same coefficient means different things in different regimes.
Read · seeing it in the market
04How professionals read it
Professionals assume coupling and look for decoupling. The default expectation for a large stock is that it follows its index; the information is in the moments it stops. A stock that holds its high while QQQ loses VWAP has decoupled to the upside; one that breaks its low while QQQ holds has decoupled to the downside. Both are readings about the stock, not the market.
They size with beta in mind. A position in a 1.8-beta name on a day with a Fed decision is a position in the index, amplified. Sizing it like a low-beta stock is how a 'stock trade' becomes an unplanned macro trade.
They also know that correlation is regime-dependent and that the regime changes fast. In a calm, stock-picking market, correlations fall and individual stories matter; in a sell-off, everything moves together and the only story is the index. Recognising which regime you are in decides whether stock selection or index direction is the job today.
05What strength looks like
Tight coupling looks like two charts with the same shape at different amplitudes: the stock makes every turn the index makes, a little larger. Nothing about the stock is being priced separately; it is a high-beta expression of the index.
Illustrative. The stock (gold) copies the index (navy) turn for turn, with more amplitude — a high-beta name on an ordinary day.
Source: illustrative teaching data — not market data
06What weakness looks like
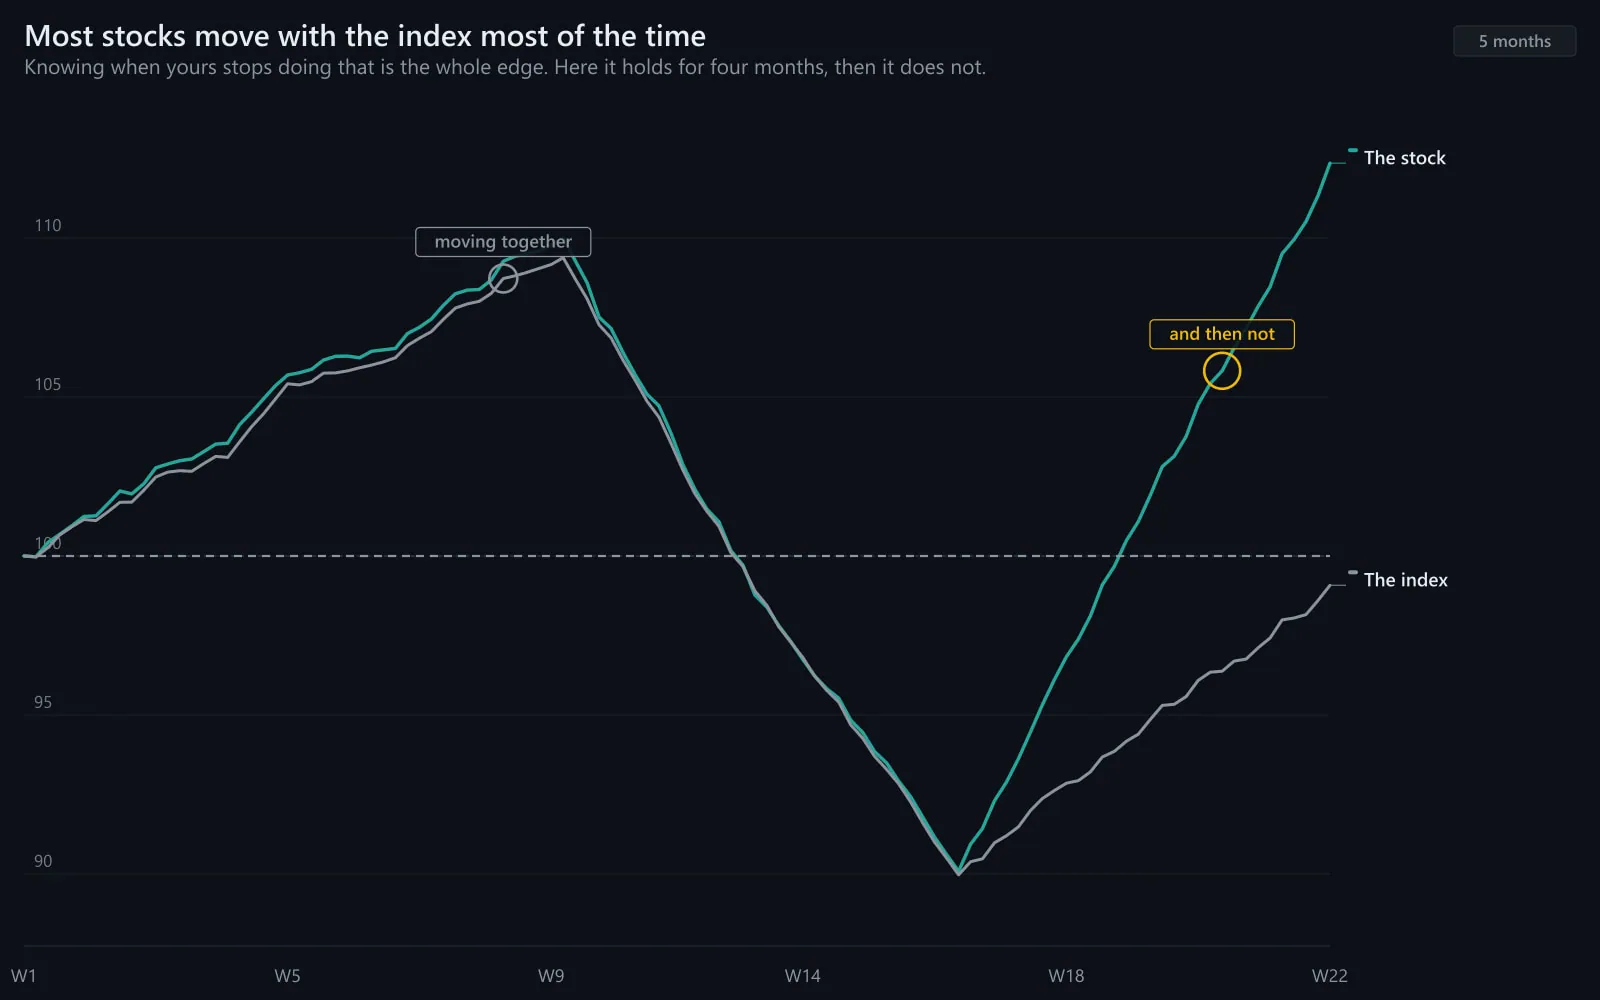
Decoupling looks like the shapes separating: the index keeps chopping while the stock begins to trend on its own. From that moment the stock is being priced on its own information — a catalyst, accumulation, a story — and it can be read as a stock rather than as an index proxy.
Illustrative. Coupled until the midpoint; then the stock (gold) trends while the index (navy) keeps ranging.
Source: illustrative teaching data — not market data
07What a divergence looks like
Decoupling is the divergence. The specific version worth the most attention: a stock that decouples to the upside during market weakness — the index sells off and the stock does not follow. It is the clearest real-time evidence of buyers who want the stock regardless of the tide, and it is one place the Advanced program looks for long candidates to study.
Coupled
- Same turns as the index, larger or smaller
- Move is explained by the index
- Read it as index exposure; size reflects beta
- Stock-specific information absent
Decoupled
- Turns the index does not make
- Holds while index falls, or breaks while it holds
- Read it as a stock — its own story
- Check the reason: catalyst, flows, news
What each tells you.
Interpret · what it means for you
08What it means for an investor
For an investor correlation is the reason 'diversification' needs more than twenty stocks from the same index: they all carry the same tide. Diversification in the usual sense means holdings with different drivers — bonds, other regions, other asset classes. It is also a warning: in a crisis, stock-to-stock correlation rises and a portfolio of 'different' stocks behaves like one.
09What it means for a trader
For a trader it is the first question about any setup: is this move the stock or the index? If it is the index, the position is really index exposure and is sized that way. If the stock has decoupled, there is stock-specific information to act on. The Advanced program runs this check — stock versus SPY/QQQ on the same screen — before every entry.
10What it cannot tell you
- Correlation is backward-looking. A coefficient from the last month says nothing certain about tomorrow.
- High correlation does not mean the stock is 'safe' or 'risky'; it means its moves are mostly the index's.
- Decoupling can be noise. One day of divergence is a flag; several are a reading.
- In a panic, correlations converge toward one and stock selection stops mattering until the tide turns.
Apply · the market right now
11What is happening right now
MAAL TRADING ACADEMY market note
No dated note has been published for this topic yet. We only publish current-market commentary written and dated by the academy — nothing auto-generated.
Data · previous close
Live levels for SPY, QQQ appear here once the licensed market-data feed is connected. We do not show unlicensed or made-up numbers.
How to check this yourself today
- Overlay a stock you follow with SPY (or QQQ) intraday. Does it make the same turns?
- Find its beta on any quote page and ask: how much of my position is really index exposure?
- Look at the last market down day: did the stock follow, fall less, or not fall?
- Check whether the market is in a stock-picking regime (low correlations, dispersion) or a macro regime (everything together).
12Visual market example
QQQ and SPY themselves are the cleanest example: tightly coupled, with QQQ running at higher amplitude. On a daily chart over months the shapes are nearly identical; the difference is magnitude. A stock that correlates with QQQ inherits that amplified relationship — which is why 'a tech stock' is usually a leveraged index position.
Illustrative. Same turns, bigger swings in the growth index.
Source: illustrative teaching data — not market data
Review · practise, keep, connect
13Test your understanding
Read the chart the way you would before a trade. Pick the answer, then read why.
1A 1.7-beta software stock is up 3.2% today. QQQ is up 2.0%. How much of the move belongs to the stock?
Illustrative.
Source: illustrative teaching data — not market data
14Key takeaways
- Assume coupling; look for decoupling. The information is in the moment a stock stops following its index.
- Beta is magnitude; correlation is consistency. Sizing without beta in mind is trading the index by accident.
- Pair the stock with the right index or its sector, or you will see false decoupling.
- Decoupling to the upside in market weakness is where traders often look for long candidates.
- In a panic correlations go to one; stock picking waits for the tide to turn.
16Learn it in class
Advanced Program · Stage 1 · Finding Stocks in Play · Stage 2 · Level II & Tape
In the Advanced program every watchlist stock is overlaid on SPY and QQQ — 'is this the stock or the index?' is asked before every entry.