
Understand · what it is and why it exists
01What it is
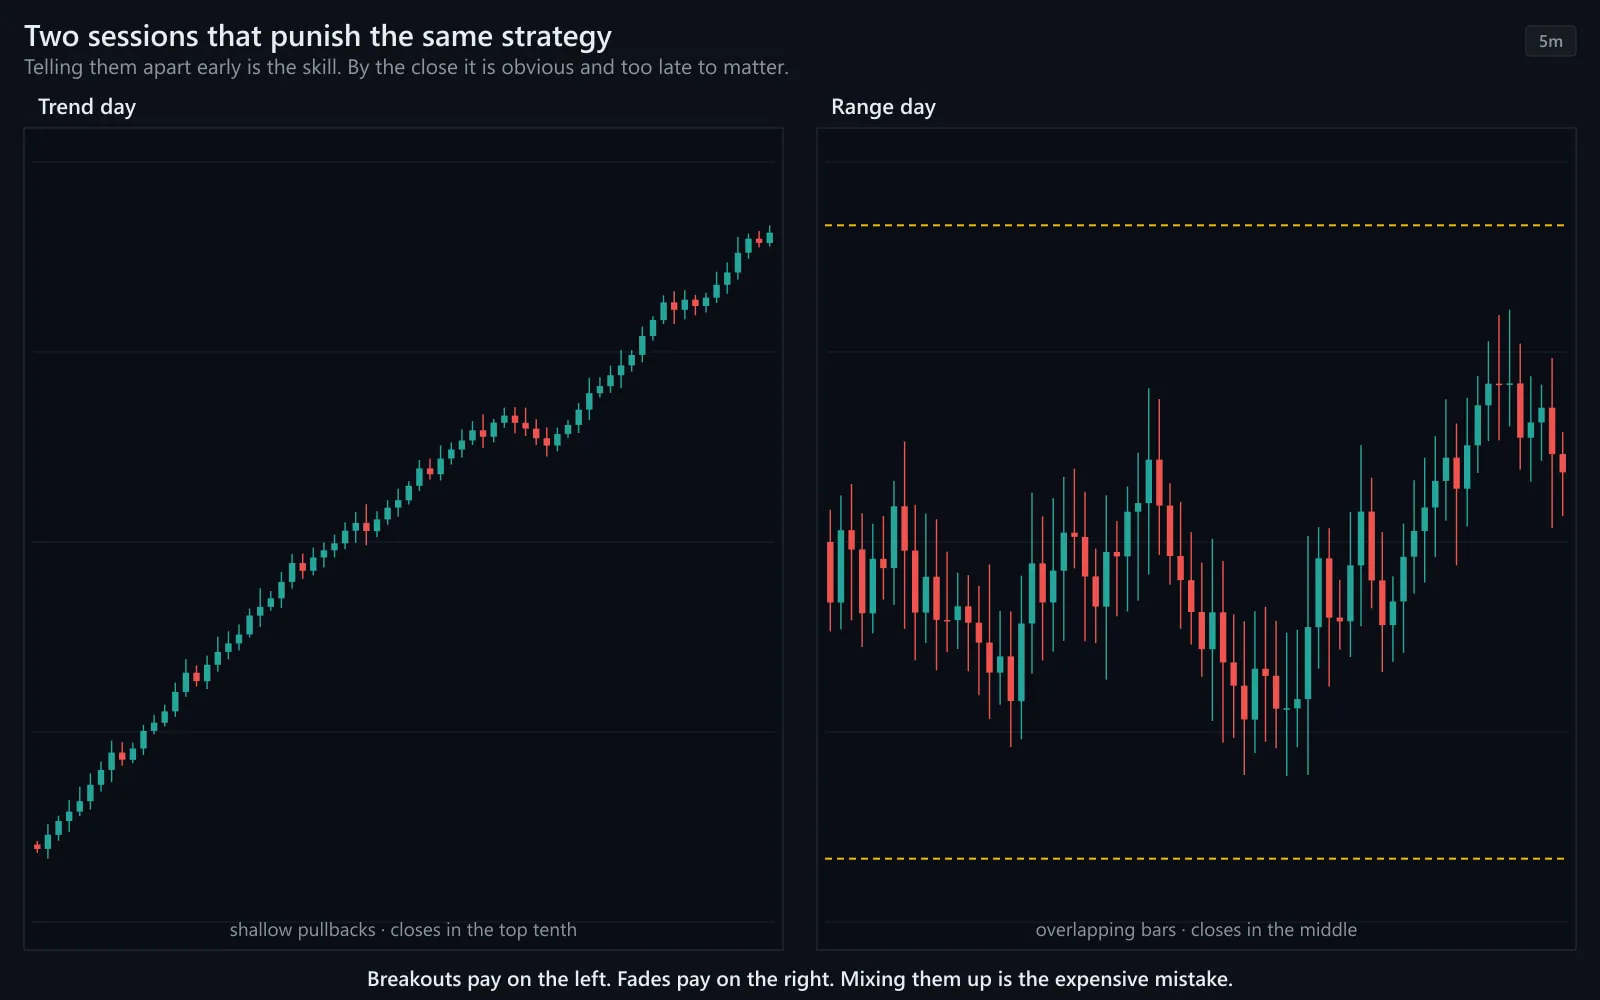
A trend day is a session that moves in one direction from near the open to near the close, with shallow pullbacks that never reverse it. A range day is a session that goes back and forth inside a band, where every push in one direction is met and reversed.
Most days are somewhere in between, but the two extremes matter because they demand opposite behaviour. On a trend day strength tends to continue, so fading it fights the day. On a range day pushes to the edges tend to reverse, so chasing a breakout fights the day. The same idea can fit one and not the other.
The goal is not to predict which day it will be. It is to recognise which day it is becoming, as early as possible, and to stop doing what does not fit it.
02Why it exists
Sessions trend when one side — buyers or sellers — has an imbalance that the other side cannot absorb: a surprise in the news, a shift in rates, a large participant repositioning over the whole day. Every pullback is met by the same persistent pressure, so price keeps going.
Sessions range when there is no such imbalance. Buyers and sellers are roughly matched, prices are accepted within a band, and moves to the edges attract the other side. Most days without a catalyst are range days, which is one reason breakouts on ordinary days so often fail.
03How it is measured or observed
There is no indicator that labels the day. Traders read a cluster of observations, most of which are visible within the first hour:
- The open and the gapA large gap that holds — price does not return to the prior close in the first thirty minutes — is a trend-day clue. A gap that fills quickly is a range-day clue.
- Opening range behaviourDoes price leave the first 15–30 minutes' range decisively and stay out? Trend. Does it break and come back inside? Range.
- VWAPThe volume-weighted average price. On a trend day price stays on one side of it and pullbacks to it hold. On a range day price crosses it repeatedly.
- BreadthAdvancers versus decliners intraday. Persistently one-sided (say 4:1) and widening is trend. Flipping between positive and negative is range.
- VolumeExpanding with the move and not fading is trend. Volume that spikes at the edges and then dies is range.
- Pullback depthTrend-day pullbacks retrace a small fraction of the move and resolve fast. Range-day 'pullbacks' retrace everything.
Read · seeing it in the market
04How professionals read it
Professionals decide early and stay humble. By the end of the first hour they have a working label — trend or range — and a plan that fits it. They do not marry the label. If a 'trend' day starts crossing VWAP and failing at new highs, it is no longer a trend day, whatever it looked like at 10 a.m.
They treat the first failed move as information. On a range day, the first breakout attempt fails and comes back into the range; experienced traders often take that failure as the day's signature and turn their attention to the edges. On a trend day, the first pullback holds above VWAP and the move continues; they read that as a sign the direction is intact.
They also watch the relationship between the index and the stock. A stock can trend on a range day if it has its own catalyst — but it is harder, and the pullbacks are deeper, because the market is not helping.
05What strength looks like
A trend day: price leaves the opening range, holds above VWAP on every pullback, breadth stays one-sided and widens, volume expands with the move, and the close is near the high. The pullbacks are shallow enough that anyone waiting for a deep one never gets in.
Illustrative. Price (navy) holds above VWAP (gold) all session; pullbacks are shallow; the close is near the high.
Source: illustrative teaching data — not market data
06What weakness looks like
A range day: the gap fills, price crosses VWAP again and again, every push to the edge of the range is reversed, breadth flips between positive and negative, volume spikes at the extremes and dies in the middle, and the close is somewhere near where the day started. Breakouts tend to fail and fades tend to hold — until the one time they don't.
Illustrative. Price (navy) oscillates around VWAP (gold); pushes to the edges reverse; the close is near the middle.
Source: illustrative teaching data — not market data
07What a divergence looks like
The dangerous day is the one that changes character: a morning that looks like a trend and an afternoon that reverses it, or a range that finally resolves into a late trend. The clue is usually in VWAP and breadth — when price loses VWAP after holding it all morning, or when breadth that was 4:1 narrows to even, the label has changed and the plan must change with it.
Trend day
- Gap holds; opening range broken and not revisited
- Price on one side of VWAP; pullbacks to it hold
- Breadth one-sided and widening
- Volume expands with the move
- Close near the extreme
Range day
- Gap fills; opening range broken then re-entered
- Price crosses VWAP repeatedly
- Breadth flips sign
- Volume spikes at edges, fades in the middle
- Close near the middle; breakouts often fail
What each clue looks like on each kind of session.
Interpret · what it means for you
08What it means for an investor
A long-term investor rarely needs to care which kind of day it is — with one exception: execution. Buying a position with a market order in the first minutes of a trend day, or at the edge of a range day, can mean paying more than needed. Many investors find patience and limit orders useful on both kinds of day.
09What it means for a trader
For a trader this is the central idea: approach must match condition. On trend days the class studies pullbacks toward VWAP; on range days, reactions at the edges with tight risk and targets toward the middle. One of the costliest habits is running a range strategy on a trend day (getting run over) or a trend strategy on a range day (getting chopped).
It also sets expectations for the afternoon. Trend days often accelerate into the close as trapped participants give up; range days often go quiet. The 2:00–3:00 PM session in the Advanced program exists to practise reading exactly this.
10What it cannot tell you
- It cannot be known at the open. The first hour gives a working label, not certainty; the day can change character.
- A trend day in the index does not guarantee a trend in your stock, and a range day does not forbid one.
- Counting clues is not a formula. Three trend clues and two range clues is 'unclear', and 'unclear' is a valid answer that usually reduces size.
- Yesterday's character does not carry over. Each session is read on its own.
Apply · the market right now
11What is happening right now
MAAL TRADING ACADEMY market note
No dated note has been published for this topic yet. We only publish current-market commentary written and dated by the academy — nothing auto-generated.
Data · previous close
Live levels for SPY, QQQ appear here once the licensed market-data feed is connected. We do not show unlicensed or made-up numbers.
How to check this yourself today
- At 10:00 Central (an hour and a half after the open), mark the opening range and note whether price is inside or outside it.
- Put VWAP on the SPY chart and count how many times price has crossed it so far.
- Check intraday advancers versus decliners. One-sided and widening, or flipping?
- Look at the volume profile: expanding with the move, or spiking at the edges?
12Visual market example
The clearest way to learn the difference is to look at the two side by side on the same axis. The trend day never returns to VWAP for long and closes near its high; the range day lives on both sides of VWAP and closes close to where it opened. Now imagine running the same breakout strategy on both.
Illustrative. Same number of bars; opposite character.
Source: illustrative teaching data — not market data
Review · practise, keep, connect
13Test your understanding
Read the chart the way you would before a trade. Pick the answer, then read why.
1It is mid-morning. Price has crossed VWAP four times and the first breakout above the opening range came back inside. Trending or ranging?
Illustrative.
Source: illustrative teaching data — not market data
2Price gapped up, never filled, has held above VWAP on two pullbacks, and breadth is 5:1 advancing. Which of these fights the clues?
Illustrative.
Source: illustrative teaching data — not market data
14Key takeaways
- Trend days move one way with shallow pullbacks; range days reverse at the edges. The same approach rarely suits both.
- Decide early from the open, VWAP, breadth, volume and pullback depth — then stay humble; the label can change.
- The first failed move is the day's signature: a failed breakout says range, a pullback that holds says trend.
- 'Unclear' is a valid reading and usually reduces size.
- Match the approach to the condition. That discipline is what the Advanced program is built to practise.
16Learn it in class
Advanced Program · Stage 3 · Trading the Opening Bell · Stage 4 · Trading Ranges
the Advanced program opens with replayed opening sessions where you call TRADE or NO TRADE — and explain which kind of day you think it is becoming.