
Understand · what it is and why it exists
01What it is
The S&P 500 is divided into eleven sectors under a standard classification system: Technology, Financials, Healthcare, Consumer Discretionary, Consumer Staples, Industrials, Energy, Utilities, Real Estate, Materials and Communication Services. Each sector has an ETF that owns the S&P 500 members in that sector, weighted by size.
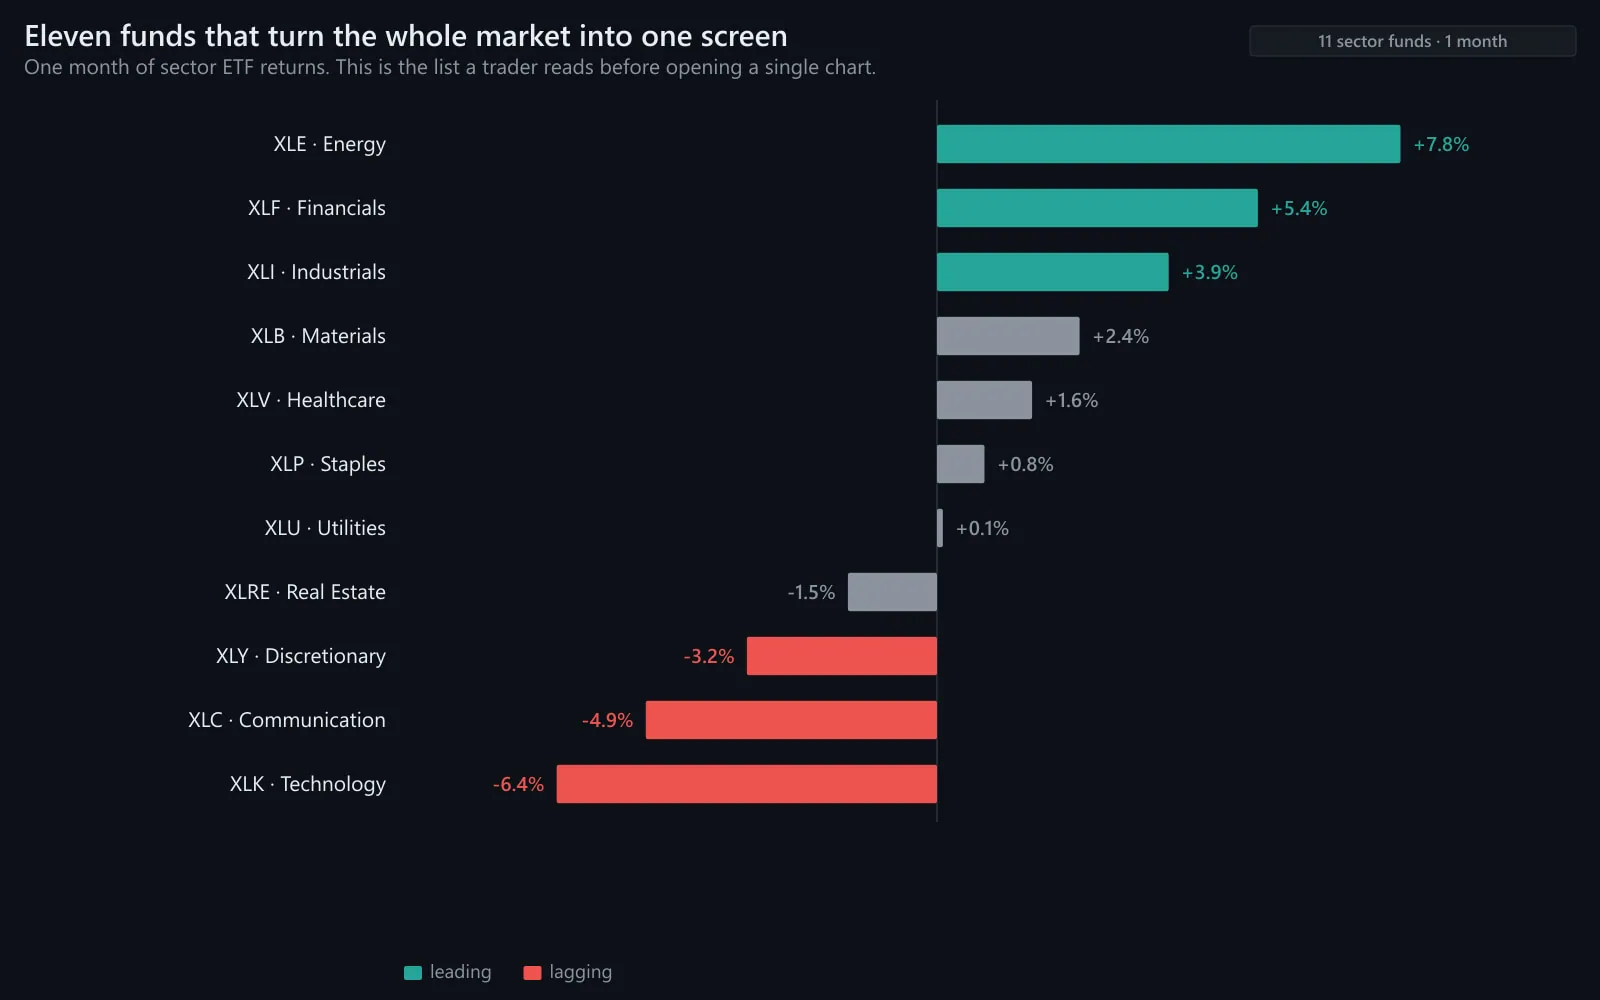
The best-known family is the SPDR 'Select Sector' funds: XLK (technology), XLF (financials), XLV (healthcare), XLY (discretionary), XLP (staples), XLI (industrials), XLE (energy), XLU (utilities), XLRE (real estate), XLB (materials) and XLC (communication services). Together they are the S&P 500 in eleven pieces.
They matter because leadership — which parts of the market are doing the work — is read at the sector level first. Eleven lines are enough to see rotation; five hundred are too many.
02Why it exists
Sector funds exist because investors and traders wanted to express views on parts of the economy without picking individual companies: own energy without choosing an oil major, own banks without choosing a bank. Packaging each sector as a fund made that a single trade.
As a reading tool they exist because the market rotates. Money moves between sectors as expectations about rates, growth, commodities and policy change. The sector ETFs turn that rotation into eleven charts anyone can compare.
03How it is measured or observed
Sector ETFs are read in relation to each other and to the index:
- The performance tableEleven sectors ranked by return over one day, one week, one month, three months. The order and its changes are the rotation.
- Sector vs SPY ratioA sector's price divided by SPY's. Rising = outperforming. The direction of each ratio is the clearest leadership read.
- Cyclical / defensive splitTechnology, discretionary, industrials, financials, materials, energy are broadly cyclical; utilities, staples, healthcare broadly defensive; real estate and communication services sit between. Which group leads is the tone.
- Weight in the indexTechnology can be near a third of the S&P; utilities a small fraction. A 2% move in technology moves the index far more than a 2% move in utilities.
- Breadth inside the sectorCap-weighted sector funds can be dominated by two or three giants. Equal-weight versions exist for several sectors and show whether the sector move is broad.
- Industry groupsSectors contain industries (semiconductors inside technology, regional banks inside financials). Leadership is often more precise one level down.
Read · seeing it in the market
04How professionals read it
Professionals open the sector table before they open a stock chart. The top three and bottom three over one month tell them the market's tone; the change in order over the last week tells them whether that tone is shifting. A trader then looks for stocks in the leading sectors, because that is where breakouts tend to have the crowd behind them.
They read sector ratios rather than sector prices. A sector can rise on the day and still be lagging if the index rose more. The ratio line removes the index's move and leaves only the relative part — which is the part that describes leadership.
They also know the weights. Technology leading moves the index; utilities leading barely does. A market where the heavyweights lag and the lightweights lead can show rotation without the index going anywhere — which is exactly the kind of session that confuses people reading only SPY.
05What strength looks like
Healthy rotation looks like leadership passing between cyclical sectors while the index keeps rising: technology leads, pauses, industrials and financials take over, then growth resumes. Several sectors make highs; no single one has to carry everything.
Illustrative. XLK (gold) outpaces SPY (navy) while utilities (grey) lag — a cyclical, growth tone.
Source: illustrative teaching data — not market data
06What weakness looks like
Unhealthy rotation looks like money leaving the market rather than moving within it: cyclicals falling together while defensives rise modestly, the index flat or down, and the sector table inverting — the groups that led for months now at the bottom.
Illustrative. After the midpoint energy (gold) turns from laggard to leader — leadership can change fast in a single sector.
Source: illustrative teaching data — not market data
07What a divergence looks like
The sector-level divergence to watch is the index at highs with the sector table showing most sectors below their own highs — only the heaviest one or two doing the lifting. That is narrow leadership made visible in eleven lines.
Cyclical (growth tone)
- XLK Technology
- XLY Consumer Discretionary
- XLI Industrials
- XLF Financials
- XLB Materials
- XLE Energy
Defensive (caution tone)
- XLU Utilities
- XLP Consumer Staples
- XLV Healthcare
- XLRE Real Estate (rate-sensitive)
- XLC Communication Services (mixed)
Which side leads is the market's tone.
Interpret · what it means for you
08What it means for an investor
For an investor sector ETFs are a way to tilt without picking stocks — and a way to understand what an index fund already holds. An S&P 500 fund that is a third technology is a technology-heavy portfolio; knowing the sector weights is knowing what you own. An investor can read the sector table without ever owning a sector fund.
09What it means for a trader
For a trader sector ETFs are the map. Stocks in play tend to be found inside leading sectors; a breakout in a lagging sector needs its own catalyst. Intraday, the sector table from the open shows where money is flowing today, and a stock moving against its sector is either a leader worth noting or a reason for caution.
10What it cannot tell you
- Sector labels are blunt. A sector fund can be dominated by two giants; check equal-weight versions or the industry level.
- Leading this month says nothing about next month. Rotation is the norm.
- A sector rising on the day is not leading if the index rose more — read ratios, not prices.
- Classification moves companies between sectors occasionally; long-run comparisons can be distorted by it.
Apply · the market right now
11What is happening right now
MAAL TRADING ACADEMY market note
No dated note has been published for this topic yet. We only publish current-market commentary written and dated by the academy — nothing auto-generated.
Data · previous close
Live levels for XLK, XLF, XLV, XLY, XLP, XLI, XLE, XLU, XLRE, XLB, XLC appear here once the licensed market-data feed is connected. We do not show unlicensed or made-up numbers.
How to check this yourself today
- Rank the eleven sector ETFs by one-month return. Note the top three and bottom three.
- Ask whether the leaders are cyclical or defensive — that is the tone.
- Chart the top sector divided by SPY. Is its ratio still rising, or starting to roll?
- For the leading sector, compare it with an equal-weight version or its main industry ETF to see whether leadership is broad.
12Visual market example
Rotation in one picture: technology leads for a stretch, then energy — a laggard for months — turns sharply higher while the index barely changes. The index reading is 'sideways'. The sector reading is 'money has moved from growth to energy', which is a different market for anyone trading either.
Illustrative. Technology (gold) fades, energy (blue) rises, SPY (navy) goes sideways.
Source: illustrative teaching data — not market data
Review · practise, keep, connect
13Test your understanding
Read the chart the way you would before a trade. Pick the answer, then read why.
1Today SPY +1.2%, XLK +1.0%, XLU +2.5%, XLE +0.2%. Which sector is leading on a relative basis?
Illustrative.
Source: illustrative teaching data — not market data
14Key takeaways
- Eleven sector ETFs are the S&P 500 in eleven pieces — the first screen for reading leadership.
- Rank them, then read ratios against SPY: rising means leading.
- Cyclical leaders mean a growth tone; defensive leaders mean caution.
- Weights matter: technology moves the index, utilities barely do.
- Check breadth inside the leader — a sector led by two giants is not broad leadership.
16Learn it in class
Advanced Program · Stage 1 · Finding Stocks in Play
The Advanced watchlist is built sector-first: the eleven ETFs are ranked before a single stock is considered.