
Understand · what it is and why it exists
01What it is
The Russell 2000 is an index of roughly two thousand small U.S. companies — the smallest two-thirds of the Russell 3000, which covers nearly the whole listed market. IWM is the ETF that owns them. Where the S&P 500 is the giants, the Russell 2000 is everyone else: regional banks, small industrials, biotech, retailers, energy drillers, software companies most people have never heard of.
Small companies differ from large ones in ways that matter to markets. They are more domestic (less foreign revenue), more reliant on borrowing (so more sensitive to interest rates), more cyclical (so more sensitive to the economy), and more volatile. A meaningful share of them are unprofitable at any given time.
That profile is why the index is read as a risk-appetite gauge. When investors are confident, they reach for small caps; when they are not, small caps are the first thing sold.
02Why it exists
The index exists to measure the part of the market the large-cap indexes ignore. Thousands of listed companies are too small for the S&P 500; without a small-cap benchmark they would be invisible as a group.
Its importance as a signal grew from its sensitivity. Because small companies feel rates, credit conditions and the domestic economy more directly than multinationals, their index tends to react earlier and harder — which makes it useful to people who own large caps too.
03How it is measured or observed
IWM is read against large caps and against the conditions small companies depend on:
- IWM vs SPYThe small-versus-large ratio. Rising = small caps leading (risk-on, broadening). Falling = small caps lagging (caution, concentration).
- Interest rates and creditSmall companies borrow more, often at floating rates. Rising rates and widening credit spreads hit them first.
- Regional banksA large weight inside the index. When regional banks are under stress, IWM usually is too.
- Profitability shareThe fraction of members that are unprofitable. A rally led by unprofitable small caps is the most speculative form of risk-on.
- Breadth confirmationIWM participating in a market rally is one of the cleanest signs the rally is broad (see Market Breadth).
- ReconstitutionThe index is rebuilt once a year; the days around it carry heavy mechanical volume that has nothing to do with fundamentals.
Read · seeing it in the market
04How professionals read it
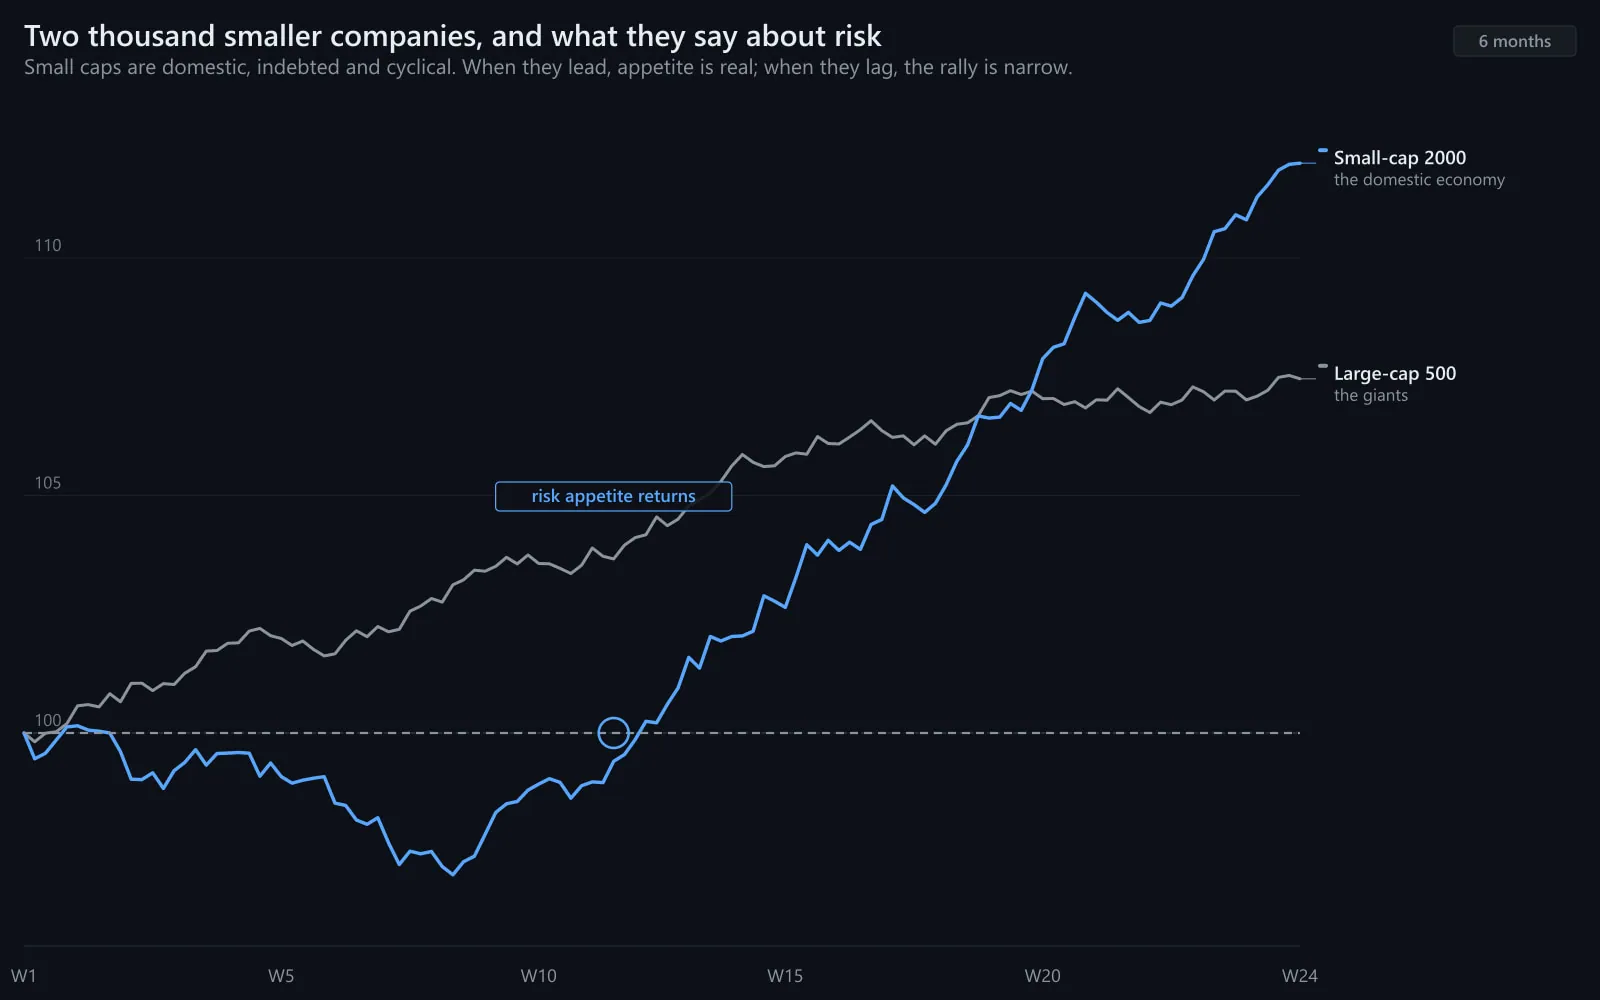
Professionals read IWM as a confirmation tool. A market rally that small caps join is broad and has the domestic economy behind it; one they sit out is narrow and led by a few multinational giants. The ratio of IWM to SPY is the quickest way to see which kind of rally is under way.
They also read it as the canary for rates and credit. When long-term yields rise or credit conditions tighten, small caps tend to show stress before large caps do. IWM breaking down while SPY holds is an early warning that the financing environment is getting harder.
And they respect its volatility. IWM routinely moves 50–100% more than SPY in a day. Position sizes that are sensible in large caps are not sensible here.
05What strength looks like
Small-cap strength looks like IWM leading SPY, regional banks healthy, credit spreads tight, and the rally broad enough that the average company — not just the giants — is making progress. It is the signature of a risk-on tone with the domestic economy cooperating.
Illustrative. IWM (blue) outpaces SPY (navy): the crowd, not the giants, is doing the work.
Source: illustrative teaching data — not market data
06What weakness looks like
Small-cap weakness looks like IWM rolling over while SPY holds: rates rising, credit tightening, regional banks under pressure, and leadership concentrating in a few large names. The large-cap index can look fine for a long time while this builds.
Illustrative. Yields (grey) climb; IWM (blue) falls behind while SPY (navy) holds — the financing environment is tightening.
Source: illustrative teaching data — not market data
07What a divergence looks like
SPY at a new high with IWM well below its own is the most cited index divergence. It means the rally is being carried by large multinationals while domestic, rate-sensitive companies are left behind. It describes fragility and concentration; it has preceded corrections and it has also persisted for years.
Confirmed
- IWM near its own highs
- IWM/SPY ratio rising
- Regional banks healthy
- Credit spreads tight
Unconfirmed
- IWM below its highs, ratio falling
- Rates rising or credit widening
- Regional banks under pressure
- Leadership concentrated in giants
Two readings of the same SPY high.
Interpret · what it means for you
08What it means for an investor
For an investor, small caps are a separate asset class with their own long history: higher volatility, deeper drawdowns, and long stretches of both outperformance and underperformance against large caps. A total-market fund includes them; an S&P 500 fund does not. Knowing which you own tells you whether you have any exposure to the domestic economy's smaller companies at all.
09What it means for a trader
For a trader IWM is the tone read and a separate instrument. As a read: IWM joining a rally is taken as support for breakouts; IWM breaking down on a day SPY is flat is an early warning. As an instrument: its larger daily range means smaller size for the same dollar risk — the same rule as any volatile stock.
10What it cannot tell you
- Small-cap weakness is not a market-crash signal. The ratio has fallen for years without a crash.
- It is a U.S.-domestic index; it says little about global growth.
- A large share of members are unprofitable, so 'the Russell is cheap' on earnings measures is often meaningless.
- Reconstitution days produce volume and moves that mean nothing fundamental.
Apply · the market right now
11What is happening right now
MAAL TRADING ACADEMY market note
No dated note has been published for this topic yet. We only publish current-market commentary written and dated by the academy — nothing auto-generated.
Data · previous close
Live levels for IWM, SPY, KRE, HYG appear here once the licensed market-data feed is connected. We do not show unlicensed or made-up numbers.
How to check this yourself today
- Chart IWM divided by SPY over six months. Rising or falling?
- Compare IWM with its own 200-day average and with SPY's position relative to its 200-day.
- Check a regional-bank ETF (KRE) — is that corner of the index under stress?
- Note the direction of the 10-year yield and of high-yield credit over the last month.
12Visual market example
The canary picture: the two indexes rise together, then yields begin to climb. Small caps break first — they borrow more and have less room — while the large-cap index keeps grinding on the strength of a few multinationals. Anyone reading only SPY sees nothing. Anyone reading IWM sees the financing environment changing.
Illustrative. Small caps (blue) react to rising yields (grey) before large caps (navy) do.
Source: illustrative teaching data — not market data
Review · practise, keep, connect
13Test your understanding
Read the chart the way you would before a trade. Pick the answer, then read why.
1SPY +5% in three months. IWM −4%. Regional banks −8%. The 10-year yield up sharply. What is the market telling you about the rally?
Illustrative.
Source: illustrative teaching data — not market data
14Key takeaways
- IWM is two thousand small, domestic, rate-sensitive companies — the risk-appetite gauge.
- Read IWM against SPY: leading means broad and risk-on; lagging means narrow and cautious.
- Small caps feel rates and credit first; IWM breaking down while SPY holds is an early warning.
- It is far more volatile than SPY, so position sizes are smaller.
- Small-cap underperformance describes concentration; it does not predict a crash.
16Learn it in class
Advanced Program · Stage 1 · Finding Stocks in Play
Advanced Day 1: IWM is read beside SPY and QQQ every morning — whether small caps join or refuse a move is part of how the class reads the day's breakouts.