
Understand · what it is and why it exists
01What it is
Historical volatility (also called realized volatility) is a measure of how much a price has moved over a past period — usually the standard deviation of daily returns, annualized so that stocks can be compared. A reading of 15% means the stock has typically moved within a range consistent with ±15% over a year; 60% means four times the movement.
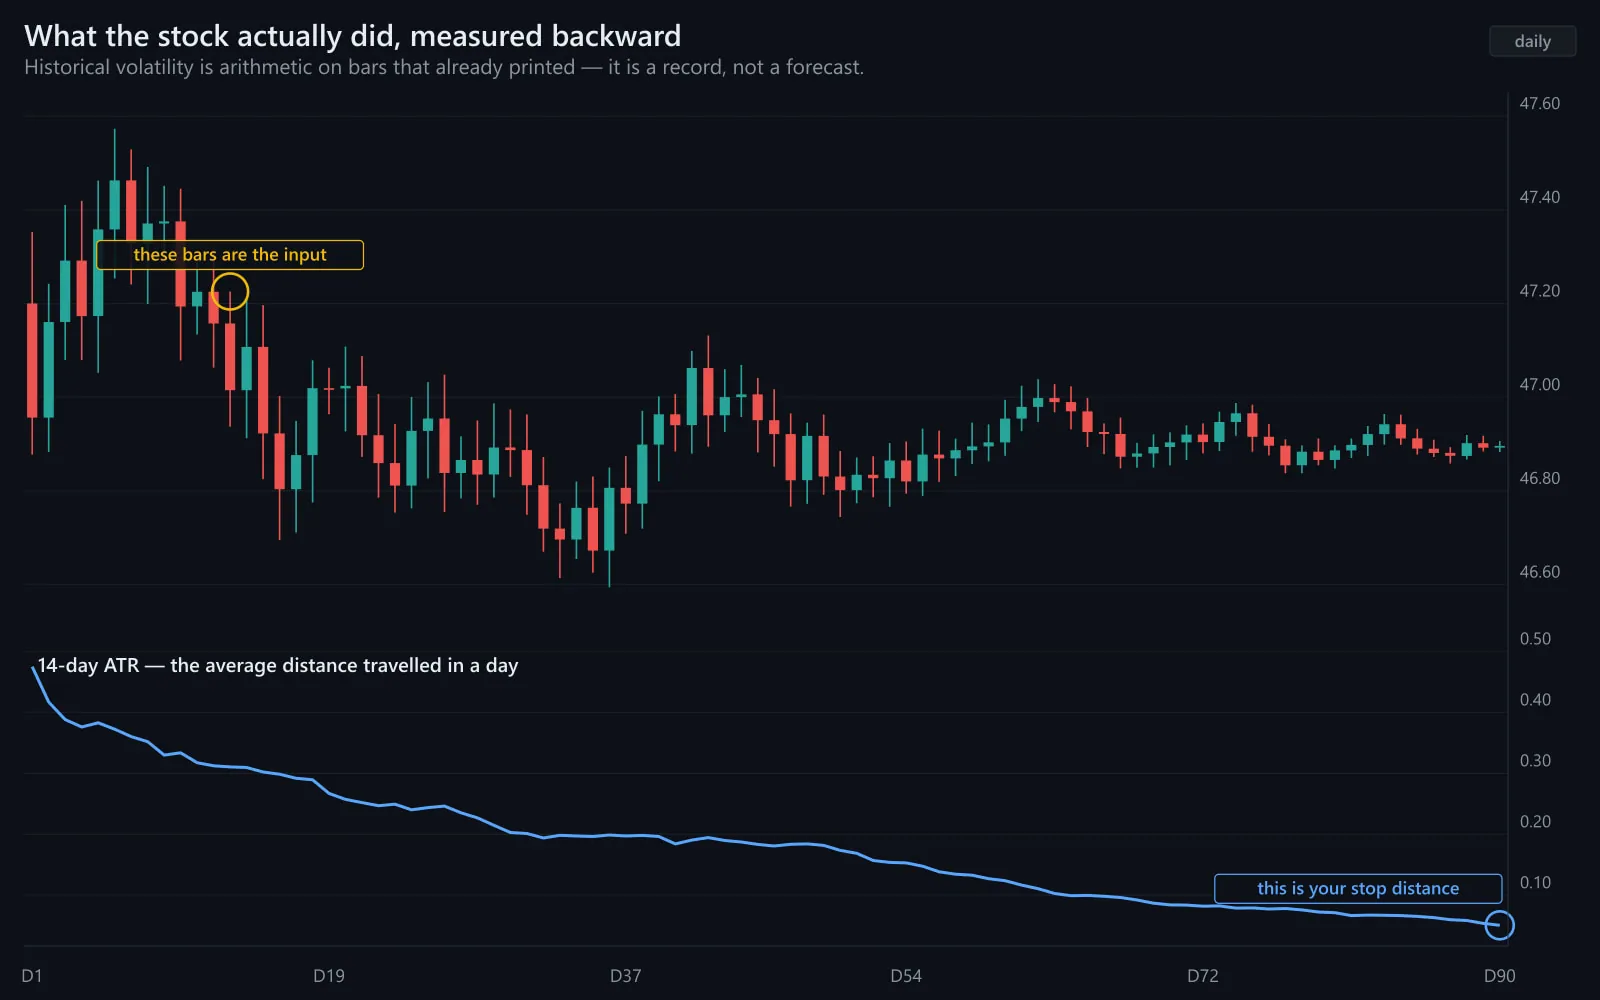
The simpler cousins — average daily range and Average True Range (ATR) — answer the same question in dollars instead of percentages: how far does this thing usually travel in a day?
It is backward-looking by construction. It cannot see tomorrow's event. What it can do is tell you how big 'ordinary' has been, which is the number your stop and your position size depend on.
02Why it exists
It exists because risk has to be measured before it can be managed, and the most honest measure of a stock's risk is what it has recently done. Volatility clusters — volatile weeks follow volatile weeks — so the recent past is a reasonable guide to the near future's magnitude, if not its direction.
03How it is measured or observed
Three versions, same idea:
- Standard deviation of returnsDaily percentage changes over 20, 30 or 60 days, annualized. The academic measure; what 'HV' means on a quote page.
- Average True Range (ATR)The average of daily ranges (including gaps) over a window, in dollars. The trader's measure — directly usable for stops and sizing.
- Range as a percent of priceYesterday's high minus low, divided by price. The simplest daily reading; noisy on its own, useful as a trend over weeks.
Read · seeing it in the market
04How professionals read it
Professionals read historical volatility as the input to position size, full stop. Decide the dollar risk, place the stop a sensible multiple of ATR away, divide. A stock with twice the ATR gets half the shares. Everything else about volatility comes after that arithmetic.
They also read its trend. Rising realized volatility means the regime is changing toward wider moves; falling means compression. Comparing the 10-day reading with the 60-day reading shows whether recent movement is above or below normal — which is the question behind 'is something happening?'
05What strength looks like
A stable historical-volatility reading — ATR steady for weeks — means the stop distance you planned is still the right one. Calm, consistent ranges are the environment in which sizing rules feel effortless.
Illustrative. Small, consistent daily moves; a steady ATR.
Source: illustrative teaching data — not market data
06What weakness looks like
A jump in realized volatility — the 10-day ATR running well above the 60-day — means yesterday's stop is now inside today's noise. The number has changed; if the position size has not, the risk has silently doubled.
Illustrative. Same number of days; several times the movement.
Source: illustrative teaching data — not market data
Interpret · what it means for you
07What it means for an investor
For an investor, historical volatility describes the ride: a 15%-volatility index fund and a 60%-volatility single stock will feel completely different to hold, and the feeling is what makes people sell at the wrong time. Knowing the number in advance is how you decide what you can actually sit through.
08What it means for a trader
For a trader it is the sizing number. The Beginner program teaches exactly this: risk per trade in dollars, stop distance from the stock's range, shares from the division. No ATR, no size, no trade.
09What it cannot tell you
- It cannot see scheduled events. A calm stock before earnings has a calm ATR and a wild tomorrow.
- It says nothing about direction.
- Short windows are noisy; one wild day moves a 10-day reading a lot.
Apply · the market right now
10What is happening right now
MAAL TRADING ACADEMY market note
No dated note has been published for this topic yet. We only publish current-market commentary written and dated by the academy — nothing auto-generated.
Data · previous close
Live levels for SPY, QQQ appear here once the licensed market-data feed is connected. We do not show unlicensed or made-up numbers.
How to check this yourself today
- Find the 14-day ATR on two stocks you follow and compare it with their 60-day ATR.
- Recompute share size for a fixed dollar risk on each.
- Check the calendar for events that the backward number cannot see.
11Visual market example
Two stocks, same price, different histories. The calm one allows a tight stop and more shares; the wild one demands a wide stop and fewer. Same dollar risk, a four-to-one difference in position size — decided entirely by a backward-looking number.
Illustrative. ATR $1.20 → stop $1.80 → 111 shares. ATR $4.80 → stop $7.20 → 27 shares.
Source: illustrative teaching data — not market data
Review · practise, keep, connect
12Test your understanding
Read the chart the way you would before a trade. Pick the answer, then read why.
1A stock's 10-day ATR is $3.00; its 60-day ATR is $1.50. What has changed?
Illustrative.
Source: illustrative teaching data — not market data
13Key takeaways
- Historical volatility measures what happened; ATR is the trader's version in dollars.
- It is the sizing input: dollar risk ÷ stop distance, where stop distance respects ATR.
- Compare short and long windows to see whether the regime is changing.
- It cannot see scheduled events or direction.
15Learn it in class
Beginner Program · Stage 5 · Capital Protection
Beginner: position sizing and stops from the stock's range — the arithmetic on this page, done by hand before the simulator.