
Understand · what it is and why it exists
01What it is
An index is a list of stocks combined into one number so the group can be tracked over time. The four that matter most in the U.S. are the S&P 500 (five hundred large companies), the Nasdaq-100 (one hundred large non-financial companies listed on the Nasdaq, heavy in technology), the Dow Jones Industrial Average (thirty large, well-known companies) and the Russell 2000 (two thousand smaller companies).
Each is built differently. The S&P 500 and Nasdaq-100 weight companies by size, so the largest move the number most. The Dow weights by share price, so a $400 stock counts more than a $40 one regardless of company size. The Russell 2000 is cap-weighted but contains only small companies, so it behaves like a different animal.
When the news says 'stocks rose today', it usually means the S&P 500. When it says 'tech rallied', it usually means the Nasdaq-100. When it says 'small caps lagged', it means the Russell 2000. Knowing which number is being quoted is the first step to knowing what actually happened.
02Why it exists
Indexes exist to summarize. Thousands of stocks trade every day; nobody can follow them all. An index compresses a group into one line that can be charted, compared and — through ETFs — bought.
They also exist to benchmark. Every fund, strategy and stock is eventually compared with an index, because 'did you beat the market?' needs a definition of the market. That comparison is what makes indexes the centre of gravity for trillions of dollars — and why their construction matters more than their names suggest.
03How it is measured or observed
Four indexes, four lenses. What each one actually contains:
- S&P 500 (SPY)~500 large U.S. companies chosen by committee, weighted by market value. Broad by company count; concentrated at the top because the largest names carry the most weight.
- Nasdaq-100 (QQQ)The 100 largest non-financial companies on the Nasdaq exchange, cap-weighted. Dominated by technology and growth; more volatile than the S&P.
- Dow Jones Industrial Average (DIA)30 large companies, weighted by share price. Narrow and old-fashioned, but widely quoted; its moves are driven by a few high-priced members.
- Russell 2000 (IWM)~2,000 small U.S. companies, cap-weighted. More domestic, more indebted, more sensitive to interest rates and the economy — the market's risk-appetite gauge.
- Equal-weight S&P 500 (RSP)The same 500 stocks with every company counted the same. The cleanest way to see what the average large company did.
- Sector indexesThe S&P 500 split into eleven sectors (technology, financials, energy…). Where leadership is read (see Sector Intelligence).
Read · seeing it in the market
04How professionals read it
Professionals rarely read one index alone. They read the spread between them. The S&P 500 against the Nasdaq-100 says whether growth is leading or lagging. The S&P against the Russell says whether small companies — the economy's most rate-sensitive corner — are participating. Cap-weight against equal-weight says whether the giants or the crowd are doing the work.
They also know what each index cannot see. The Dow's thirty members miss almost everything; the Nasdaq-100 misses banks entirely; the S&P 500 misses small companies; all four miss the rest of the world. A day when every index agrees is informative because the lenses are different. A day when they disagree is more informative still.
Finally, they watch the indexes at their levels — prior highs, prior lows, the 50- and 200-day averages — because so many participants watch the same levels that price tends to react at them. The index is a map of where the crowd is paying attention.
05What strength looks like
A healthy market is one where the indexes agree: the S&P 500 trends up, the Nasdaq-100 leads or keeps pace, the Russell 2000 participates, and equal-weight tracks cap-weight. Different lenses, same picture. That agreement is what 'broad' means.
Illustrative. SPY, QQQ, DIA and IWM moving in the same direction — a market in agreement.
Source: illustrative teaching data — not market data
06What weakness looks like
A fragile market is one where the indexes disagree: the S&P 500 and Nasdaq-100 make highs on the strength of a few large technology names while the Russell 2000 and equal-weight S&P fall. The headline says up; three of the four lenses say something else. Narrow leadership is not a reason to sell, but it is a reason to know what you own.
Illustrative. After the first third, SPY keeps rising while IWM (small caps) declines — the market is splitting.
Source: illustrative teaching data — not market data
07What a divergence looks like
Index divergence is the market's most visible warning and its most abused one. Small caps lagging large caps has preceded corrections — and has also persisted for years while large caps kept rising. Read it as a description of fragility and concentration, not as a timer.
Agreement
- SPY, QQQ and IWM all near highs
- Equal-weight keeping pace
- Several sectors leading
- Dow confirming, for what it is worth
Disagreement
- SPY/QQQ at highs, IWM well below
- Equal-weight flat or down
- One sector doing the lifting
- Headline up, average stock down
What to check when one index makes a new high.
Interpret · what it means for you
08What it means for an investor
An investor's job is to know which index they actually own. An S&P 500 fund is a large-cap, U.S.-only, top-heavy holding; a total-market fund adds small caps; an international fund adds the rest of the world. None of them is 'the market' — each is a lens, and diversification is owning more than one.
It is also worth knowing that index returns are driven by different things over time: rates for small caps, earnings growth for large technology, the economy for industrials. The index you chose decides which of those you are betting on, whether you meant to or not.
09What it means for a trader
A trader treats the indexes as the weather report. Before looking at any stock, they know what SPY and QQQ are doing today and whether IWM is along for the ride. A stock trading with its index has the crowd behind it; one trading against it is either a leader or a problem, and which one matters.
They also pick the right index for the stock. A semiconductor name should be read against QQQ, a regional bank against IWM or the financial sector, an industrial against the S&P. Comparing a growth stock with the Dow tells you nothing.
10What it cannot tell you
- No index is the whole market. Each excludes most listed companies and all non-U.S. ones.
- A cap-weighted index tells you what the giants did, not what most stocks did.
- The Dow's daily points move is nearly meaningless as information; percentage moves in broad indexes are what matter.
- Index levels are not 'expensive' or 'cheap' on their own. A number only means something next to earnings, rates and history.
Apply · the market right now
11What is happening right now
MAAL TRADING ACADEMY market note
No dated note has been published for this topic yet. We only publish current-market commentary written and dated by the academy — nothing auto-generated.
Data · previous close
Live levels for SPY, QQQ, DIA, IWM, RSP appear here once the licensed market-data feed is connected. We do not show unlicensed or made-up numbers.
How to check this yourself today
- Write down the one-month change for SPY, QQQ, DIA and IWM. Which is leading, which is lagging?
- Compare SPY with RSP (equal-weight). Are the giants or the crowd doing the work?
- Note where SPY and QQQ sit relative to their 50-day and 200-day averages.
- Check whether IWM is above or below its level from three months ago — small caps are the quickest read on risk appetite.
12Visual market example
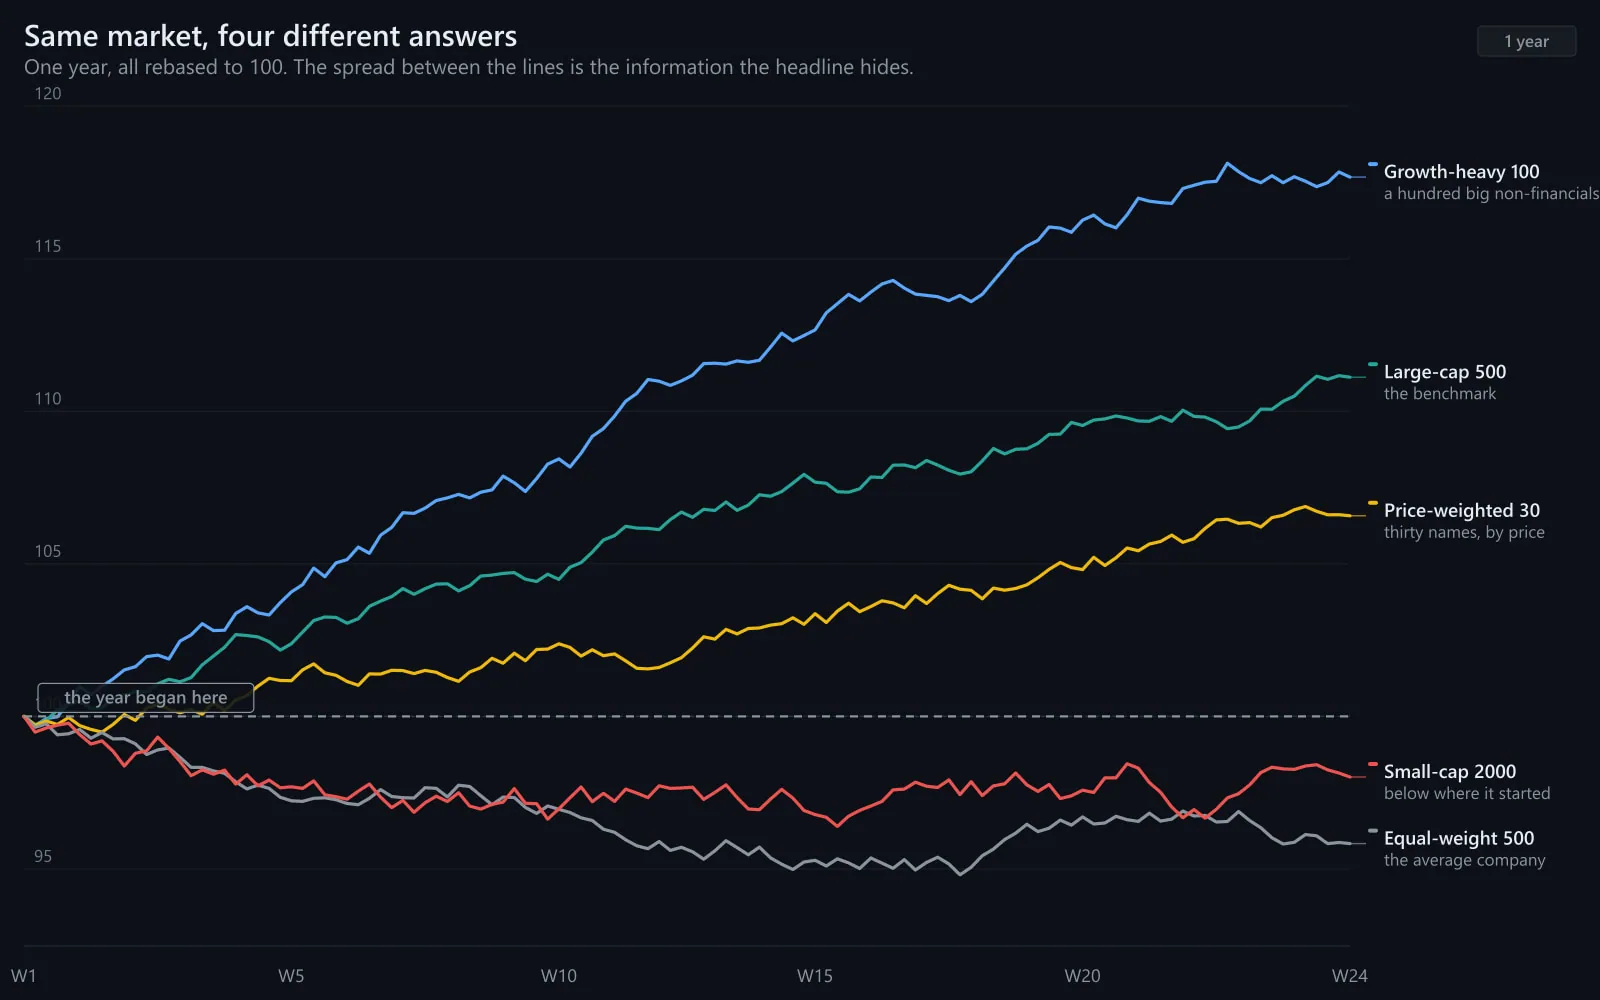
The most useful picture is all four indexes on the same scale. For a while they move together; then the growth index pulls ahead, the small-cap index stalls, and the headline S&P sits between. Which market you think you are in depends entirely on which line you are watching — which is why professionals watch all of them.
Illustrative. Growth (gold) leads, small caps (blue) lag, the S&P (navy) sits between.
Source: illustrative teaching data — not market data
Review · practise, keep, connect
13Test your understanding
Read the chart the way you would before a trade. Pick the answer, then read why.
1Over a month: SPY +4%, QQQ +7%, IWM −2%, RSP +1%. What kind of market is this?
Illustrative.
Source: illustrative teaching data — not market data
2The Dow fell 300 points today and the S&P 500 rose 0.4%. Which statement is most accurate?
Illustrative.
Source: illustrative teaching data — not market data
14Key takeaways
- 'The market' is usually the S&P 500 — a cap-weighted, large-cap, U.S.-only lens.
- The Nasdaq-100 reads growth; the Russell 2000 reads risk appetite; equal-weight reads the average stock; the Dow reads thirty price-weighted names.
- Read the spreads between indexes, not one index alone. Agreement means broad; disagreement means narrow.
- Compare a stock with the index it actually belongs to.
- Divergence between indexes describes fragility, not timing.
16Learn it in class
Beginner Program · Stage 3 · How the Stock Market Works
Beginner Day 1: you look up the indexes, learn what each number in the news actually contains, and find the bid, ask and spread on SPY yourself.