
Understand · what it is and why it exists
01What it is
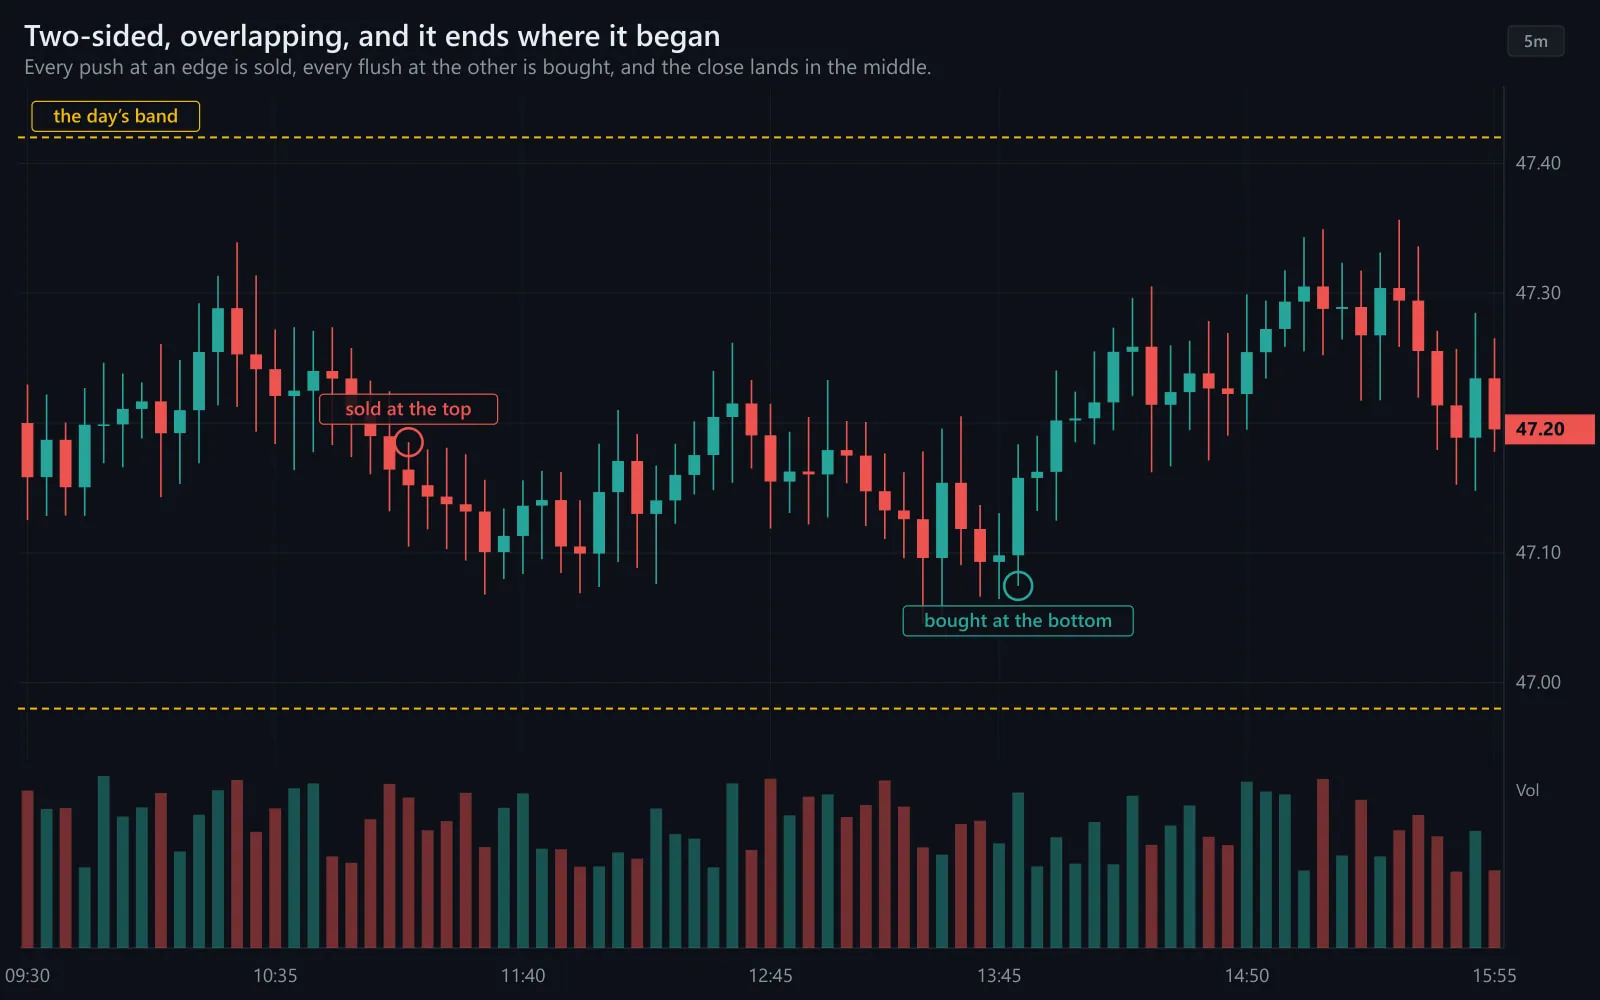
A range day is a session in which price is accepted inside a band: every push toward the top of the band attracts sellers, every push toward the bottom attracts buyers, and the close lands somewhere near the middle. Bars overlap. The opening range is broken and then re-entered. Nothing sticks.
Most sessions without a catalyst are range days or something close to one. That is not a failure of the market; it is the market finding a fair price and holding it until new information arrives.
The defining feature is not a lack of movement — range days can be choppy and fast — but a lack of persistence: neither side can hold a gain.
02Why it exists
Range days exist because buyers and sellers are roughly matched and there is no new reason to move. Prices reached on the previous session are treated as fair; moves away from fair value are faded by participants who are happy to buy lower and sell higher inside a known band. Without an imbalance, there is nothing to push the band open.
03How it is measured or observed
The same five observations as a trend day, read the other way:
- Gap fillAn opening gap is filled — price returns to the prior close — inside the first hour.
- Opening-range re-entryPrice breaks the first 15–30 minutes' range and then comes back inside it. The break failed.
- VWAP crossesPrice crosses the volume-weighted average price repeatedly. Neither side can hold it.
- Overlapping barsConsecutive bars share most of their range; the chart looks like a band, not a staircase.
- Close locationThe close lands in the middle half of the day's range.
Read · seeing it in the market
04How professionals read it
Professionals identify a range day by its first failure. The first breakout attempt that comes back inside the range is the signature; from that point many shift their working plan to the edges of the band — with tight risk and modest targets — and stop expecting breakouts to hold.
They measure the band early. The opening range, yesterday's high and low, and VWAP give the likely edges; price reacting at those levels and reversing confirms them. Inside the band there is little to do; many wait for the edges or do nothing.
They also keep one eye on the exit. Range days can resolve late into a short trend — a final-hour break that actually holds. The clue is usually breadth and volume suddenly agreeing with the direction after hours of disagreement.
05What strength looks like
A clean range day: the gap fills, the opening-range break fails, price oscillates around VWAP, each edge holds, volume spikes at the extremes and dies in the middle, and the close is near the open. On a day like this, fades have tended to fare better than chases.
Illustrative. Price (navy) crosses VWAP (gold) repeatedly; pushes to the edges reverse; the close is near the middle.
Source: illustrative teaching data — not market data
06What weakness looks like
The dangerous range day is the one that looked like a trend first: a strong open that fades, a gap that fills at 10:15, and a crowd of breakout buyers now trapped above the range. When those buyers give up, the move back through the middle can be sharp — which is why the first failed breakout matters so much.
Illustrative. A push above the band (navy) reverses and returns to VWAP (gold); the trapped buyers fuel the move down.
Source: illustrative teaching data — not market data
Interpret · what it means for you
07What it means for an investor
For an investor a range day is the friendliest kind of session to act in: prices are stable, spreads are normal, and a limit order inside the band tends to fill. There is no need to hurry; nothing is running away.
08What it means for a trader
For a trader a range day is a discipline test. The approach studied in class is reacting at the edges with tight stops and modest targets — or standing aside. Running a breakout approach on a range day is a common way to lose money slowly: every break looks like the one that will hold. On a range day, many do not. No valid setup, no trade.
09What it cannot tell you
- A range day can resolve late; the label is provisional until the close.
- The band's edges are estimates; price can overshoot them before reversing.
- A quiet range in the index does not mean every stock is quiet — names with their own catalyst can trend regardless.
Apply · the market right now
10What is happening right now
MAAL TRADING ACADEMY market note
No dated note has been published for this topic yet. We only publish current-market commentary written and dated by the academy — nothing auto-generated.
Data · previous close
Live levels for SPY, QQQ appear here once the licensed market-data feed is connected. We do not show unlicensed or made-up numbers.
How to check this yourself today
- On SPY, note whether today's gap (if any) has filled.
- Count the VWAP crosses so far in the session.
- Mark the opening range: has price broken it and come back inside?
- Note where price sits in the day's range at midday — middle half, or near an extreme?
11Visual market example
The same session viewed as bands: on a range day the edges are where the activity is. Volume arrives at the top and bottom of the band, where fades are placed, and disappears in the middle, where there is nothing to do. Read that volume profile and the day labels itself.
Illustrative. Volume spikes at the open, at each test of the edges, and at the close; the middle of the day is quiet.
Source: illustrative teaching data — not market data
Review · practise, keep, connect
12Test your understanding
Read the chart the way you would before a trade. Pick the answer, then read why.
1Price broke above the opening range at 9:50, came back inside it at 10:10, and has crossed VWAP three times since. A new high is forming at 11:30. What is the more reasonable read?
Illustrative.
Source: illustrative teaching data — not market data
13Key takeaways
- A range day is acceptance inside a band: edges are faded, breakouts fail, the close is near the middle.
- The first failed breakout is the signature.
- Traders tend to work the edges with tight risk, or stand aside, rather than chase.
- Watch for the late resolution — breadth and volume finally agreeing is the clue.
15Learn it in class
Advanced Program · Stage 4 · Trading Ranges
Advanced Day 1: range high, range low, entry area, stop, target — planned before price gets there, then executed live at 2:00.