
Understand · what it is and why it exists
01What it is
VWAP — the volume-weighted average price — is the average price paid for every share traded so far in the session, weighted by how many shares changed hands at each price. It is, quite literally, where the average participant in today's session stands.
That makes it a different kind of line from a moving average. When price is above VWAP, the average buyer today is in profit and the average seller is sorry; below it, the reverse. Institutions benchmark their executions against it, which is why it attracts orders and why price tends to react there.
02Why it exists
VWAP exists because large participants need a fair benchmark for the day's executions — 'did we buy better or worse than the average?' — and because a price that many people are anchored to becomes a price that many people act around. The behaviour of price at VWAP is the behaviour of the crowd's break-even point.
03How it is measured or observed
It is computed continuously from the open; what you read is how price treats it:
- SideIs price above or below VWAP, and has it stayed there? One side all session is a trend clue; repeated crossing is a range clue.
- TestsWhen price returns to VWAP, does it hold (bounce away) or fail (cross through)? Held tests confirm the side; failed tests change it.
- SlopeA rising VWAP means buyers have paid up through the day; a flat VWAP means a balanced session; a falling one means sellers have been in control.
- DistancePrice far from VWAP is stretched relative to the average participant and more likely to pull toward it; price sitting on VWAP is undecided.
Read · seeing it in the market
04How professionals read it
Professionals read VWAP as the session's referee. Above and holding on tests: buyers are in control, and pullbacks toward the line are where many look for long setups. Below and holding: sellers are in control, and rallies to the line are where many look for short setups. Crossing back and forth: nobody is in control, and the line is noise.
They read the first real test carefully. On a trend day the first return to VWAP is absorbed — price touches and turns. On a range day it is sliced through as though the line were not there. That single test is one of the cleaner early labels available.
They also use it as an anchor for risk. A long taken on a VWAP pullback has an obvious invalidation — a decisive loss of the line — which keeps the stop close and the decision honest.
05What strength looks like
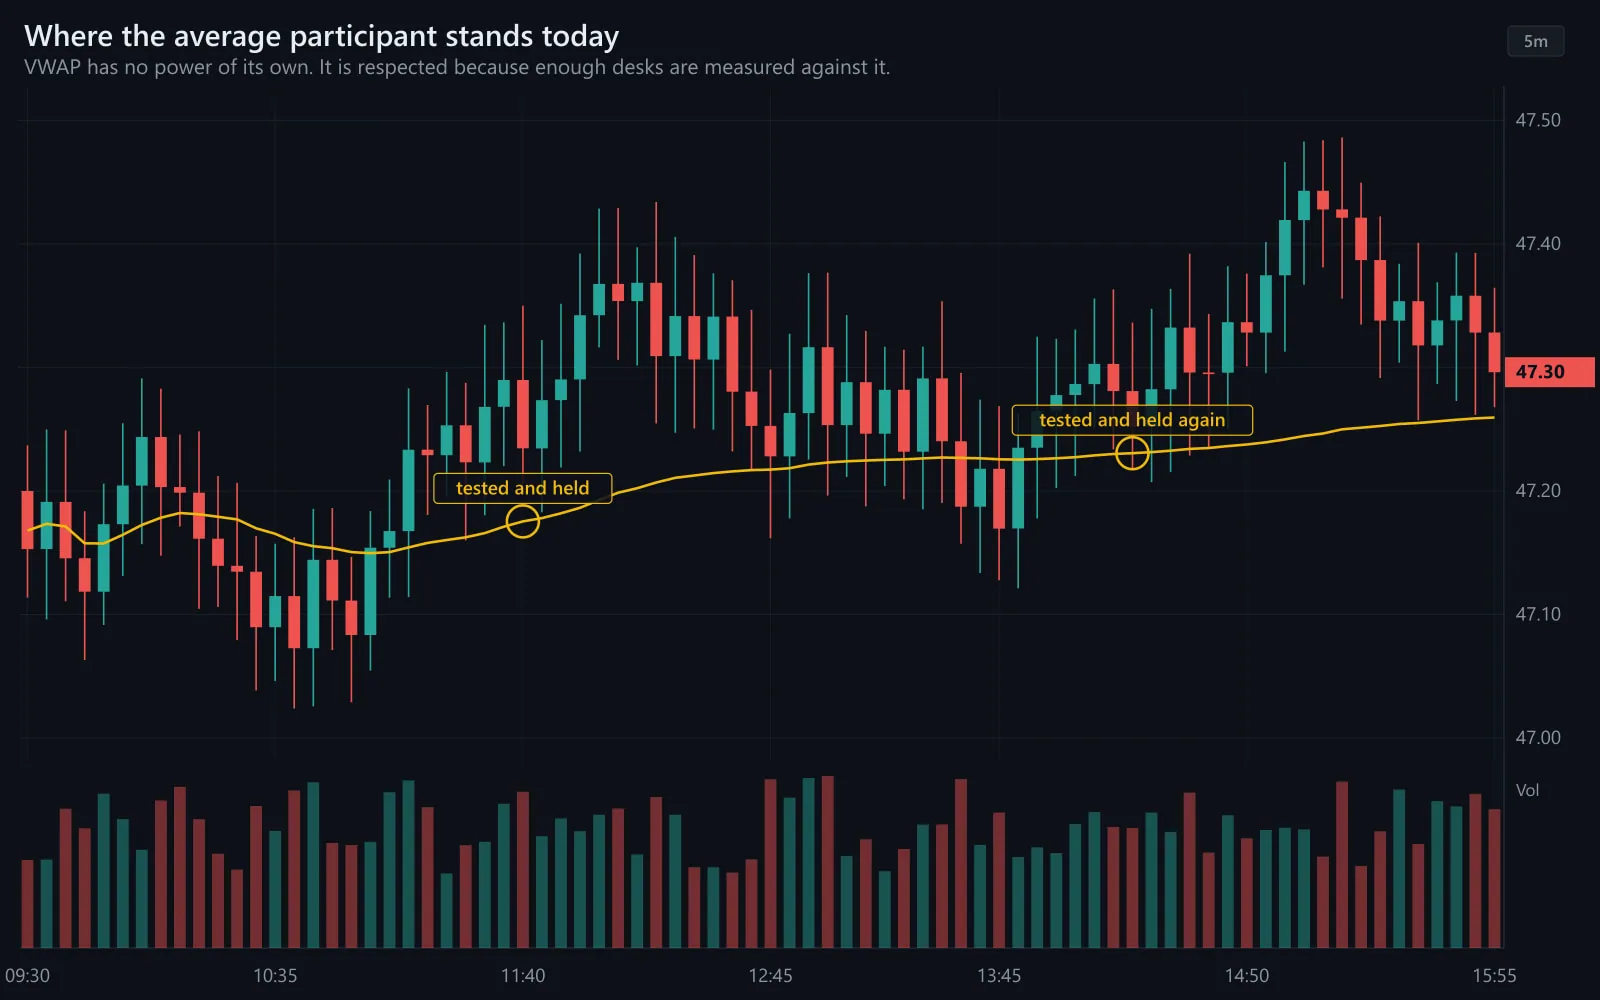
VWAP doing its job on a trend day: price stays above it, every return to it is absorbed, and the line itself rises as buyers keep paying up. Each held test is a clue that the label is still 'trend'.
Illustrative. Price (navy) returns to VWAP (gold) twice and holds both times.
Source: illustrative teaching data — not market data
06What weakness looks like
VWAP on a range day: crossed again and again, with no test holding for long. The average participant is neither winning nor losing, and the line is useless as support or resistance — which is itself the information.
Illustrative. Price (navy) crosses VWAP (gold) many times; no side holds it.
Source: illustrative teaching data — not market data
Interpret · what it means for you
07What it means for an investor
For an investor VWAP is an execution benchmark rather than a decision tool. Buying near or below the day's VWAP means buying at or better than the average participant did; some investors use it as a reference for a limit order and as a fair way to judge a fill afterward.
08What it means for a trader
For a trader VWAP is the most practical single line on an intraday chart: it helps set the working label, anchors the pullbacks studied on trend days, and gives a clean invalidation. It is also the line most often traded mechanically — 'buy every touch' — an approach that fits trend days and tends to bleed on range days. The label comes first; the line comes second.
09What it cannot tell you
- VWAP resets every session; it says nothing about the multi-day picture.
- On thin-volume sessions it is dominated by a few prints and reacts poorly.
- A held test is a clue, not a guarantee; the next test can fail.
Apply · the market right now
10What is happening right now
MAAL TRADING ACADEMY market note
No dated note has been published for this topic yet. We only publish current-market commentary written and dated by the academy — nothing auto-generated.
Data · previous close
Live levels for SPY, QQQ appear here once the licensed market-data feed is connected. We do not show unlicensed or made-up numbers.
How to check this yourself today
- Put VWAP on an intraday SPY chart and note which side price is on.
- Count the crosses since the first half hour.
- Find the first real test of VWAP today: did it hold or fail?
- Note the slope of VWAP — rising, flat, or falling — and whether it agrees with the day's direction.
11Visual market example
The same line on two different days: on the trend day it is a floor, on the range day it is a revolving door. Nothing about the computation changed. What changed is who is in control — and price at VWAP is how you find out.
Trend day
- Gap holds; opening range left and not revisited
- One side of VWAP; pullbacks to it hold
- Breadth one-sided and widening
- Volume expands with the move
- Close near the extreme
Range day
- Gap fills; opening range broken then re-entered
- VWAP crossed again and again
- Breadth flips sign
- Volume spikes at the edges, dies in the middle
- Close near the middle; breakouts fail
The same five clues, read on each kind of session.
Review · practise, keep, connect
12Test your understanding
Read the chart the way you would before a trade. Pick the answer, then read why.
1Price has been above VWAP all morning. At 12:40 it returns to the line for the first time, touches it, and turns up on rising volume. What does the test tell you?
Illustrative.
Source: illustrative teaching data — not market data
13Key takeaways
- VWAP is where the average participant in today's session stands.
- Side, tests, slope and distance are what you read — not the line itself.
- Held tests lean trend; repeated crosses lean range.
- Buying every touch fits trend days and tends to bleed on range days: label first, line second.
15Learn it in class
Advanced Program · Stage 4 · Trading Ranges
Advanced Day 1: range structure and live range execution, with VWAP as one of the levels in every plan — Symbol → Setup → Entry → Stop → Size → Target.