
Understand · what it is and why it exists
01What it is
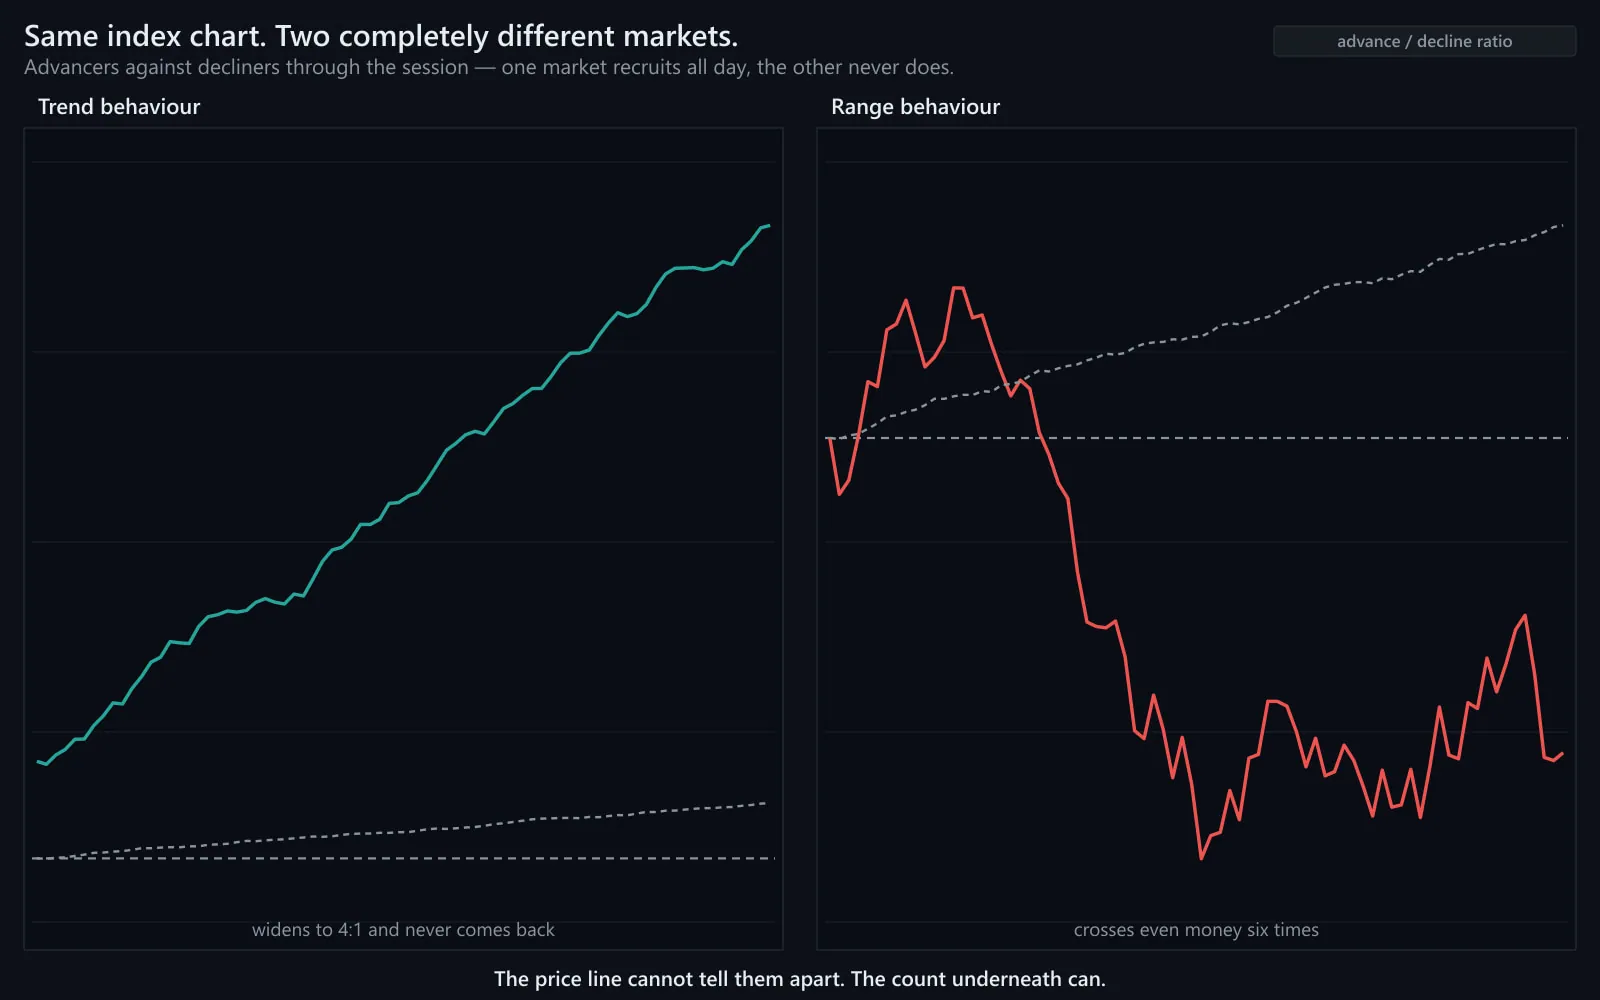
Breadth behaviour is how the count of advancing versus declining stocks moves through the session. On a trend day it is one-sided and widening: more stocks join the move as the day goes on. On a range day it flips between positive and negative, because nothing is persistent enough to carry most stocks in one direction.
It answers a question the index alone cannot: is this move a crowd, or is it a few very large companies dragging a reluctant market?
02Why it exists
Breadth exists because the index is a weighted average and a handful of giants can move it on their own. A move with broad participation reflects a change in the whole market's appetite; a move without it reflects a few stocks. The two look identical on the index chart and behave very differently afterward.
03How it is measured or observed
Read intraday, in plain terms:
- Advancers versus declinersHow many stocks in the index (or on the exchange) are up on the day versus down. 4:1 one way is one-sided; near 1:1 is balanced.
- Direction of the ratioWidening through the day (more stocks joining) is trend behaviour; narrowing or flipping sign is range behaviour.
- Up-volume versus down-volumeThe same idea weighted by volume: is the money flowing one way or both ways?
- Equal-weight versus cap-weightAn equal-weight version of the index moving with the cap-weighted one means the crowd is participating; diverging means the giants are doing the work.
Read · seeing it in the market
04How professionals read it
Professionals use breadth as a second opinion on the index. An index new high with breadth widening is a crowd; the same high with breadth flat or negative is a handful of names, and the move is treated with suspicion however good the chart looks.
Intraday they watch for the flip. Breadth that starts 3:1 positive and drifts toward even by midday is the market losing conviction — often the first sign that a morning that looked like a trend is becoming an afternoon range. Breadth that keeps widening supports the trend label.
They never read it alone. Breadth is a participation count; it says nothing about price levels, volume, or what the leaders are doing. It is one column in a checklist, beside price action, volume, Level II and the tape.
05What strength looks like
Breadth on a trend day: one-sided from the open and widening all session. More stocks join the move every hour, and the index's close near its high is backed by a crowd rather than a few giants.
Illustrative. The ratio (navy) starts positive and widens through the session.
Source: illustrative teaching data — not market data
06What weakness looks like
Breadth on a range day: a coin flip. The ratio crosses 1:1 repeatedly, the index's moves are carried by a few names each time, and no direction gathers a crowd. A breakout attempted on this breadth is a breakout without participation.
Illustrative. The ratio (navy) oscillates around 1:1; neither side recruits the market.
Source: illustrative teaching data — not market data
Interpret · what it means for you
07What it means for an investor
For an investor breadth is a health check on a rally. A market rising on broad participation is a different animal from one rising on five stocks, and the difference shows up in how it behaves when those five stocks stumble. It is context for how much to trust a new high — not a timing tool.
08What it means for a trader
For a trader breadth decides how much to trust the day's label. Trend clues with breadth widening are strong; trend clues with breadth flat are weak, and many reduce size to match. A breakout in a stock on a day when the market's breadth is a coin flip is fighting the crowd — possible, but harder, and pullbacks tend to be deeper.
09What it cannot tell you
- Breadth counts stocks, not dollars; a few giants can move the index against it for a long time.
- It says nothing about price levels or where to enter.
- Extreme readings can persist; they are not timers.
Apply · the market right now
10What is happening right now
MAAL TRADING ACADEMY market note
No dated note has been published for this topic yet. We only publish current-market commentary written and dated by the academy — nothing auto-generated.
Data · previous close
Live levels for SPY, QQQ appear here once the licensed market-data feed is connected. We do not show unlicensed or made-up numbers.
How to check this yourself today
- Find today's advancers versus decliners for the S&P 500 or the NYSE.
- Note whether the ratio has widened or narrowed since the first hour.
- Compare an equal-weight S&P 500 ETF with SPY on the day: moving together, or diverging?
- On the last new index high, check whether breadth was widening or flat.
11Visual market example
The same two days as participation counts: on the trend day the ratio widens without interruption; on the range day it never leaves the neighbourhood of 1:1. A trader who only watched the index chart would see two sessions; a trader watching breadth sees two different markets.
Illustrative. Widening (navy) versus a coin flip (muted).
Source: illustrative teaching data — not market data
Review · practise, keep, connect
12Test your understanding
Read the chart the way you would before a trade. Pick the answer, then read why.
1The index is making a new high at 1:30 PM. Breadth opened 3:1 positive and is now 1.1:1. What is the read?
Illustrative.
Source: illustrative teaching data — not market data
13Key takeaways
- Breadth is participation: a crowd versus a handful.
- One-sided and widening is trend behaviour; flipping sign is range behaviour.
- A new high on narrowing breadth deserves suspicion.
- Breadth is one column in the checklist, never a signal on its own.
15Learn it in class
Advanced Program · Stage 1 · Finding Stocks in Play
Advanced Day 1: the watchlist is built against the market's tone — and breadth is how the tone is read before any stock is chosen.