
Understand · what it is and why it exists
01What it is
Relative strength during market weakness is the specific case where the index declines and a stock does not follow — it trades sideways, or falls far less, while everything around it is sold. It is the most informative relative-strength reading there is, because holding up in a sell-off requires buyers willing to act against the tide.
The stock may look boring. A flat line during a decline is the whole signal.
02Why it exists
It exists because sell-offs are indiscriminate. Index funds sell every member; fear sells everything. A stock that holds through that is being bought by participants who specifically want it — accumulation under cover of the market's noise. When the selling pressure lifts and that demand is still there, such names tend to move early.
03How it is measured or observed
What to look for while the market falls:
- Flat or rising price during an index declineThe plainest version. Overlay the stock and SPY.
- Ratio making new highsStock ÷ SPY rising even as both fall in absolute terms.
- Holding above a level the index lostThe stock holds its 50-day while SPY breaks its own.
- Shallow drawdownStock down 3% from its high while the index is down 10%.
- VolumeHeavy volume with little price damage — absorption at work.
Read · seeing it in the market
04How professionals read it
Professionals keep a list during every sell-off: the names that did not go down. That list is their candidate set for when the index stabilises, because those names have demonstrated demand and have the least overhead supply to work through.
They wait for the index to stop falling before acting on the list. Relative strength in weakness identifies candidates; it does not say the decline is over. A setup is considered only once the market turns and the candidate leads the turn.
05What strength looks like
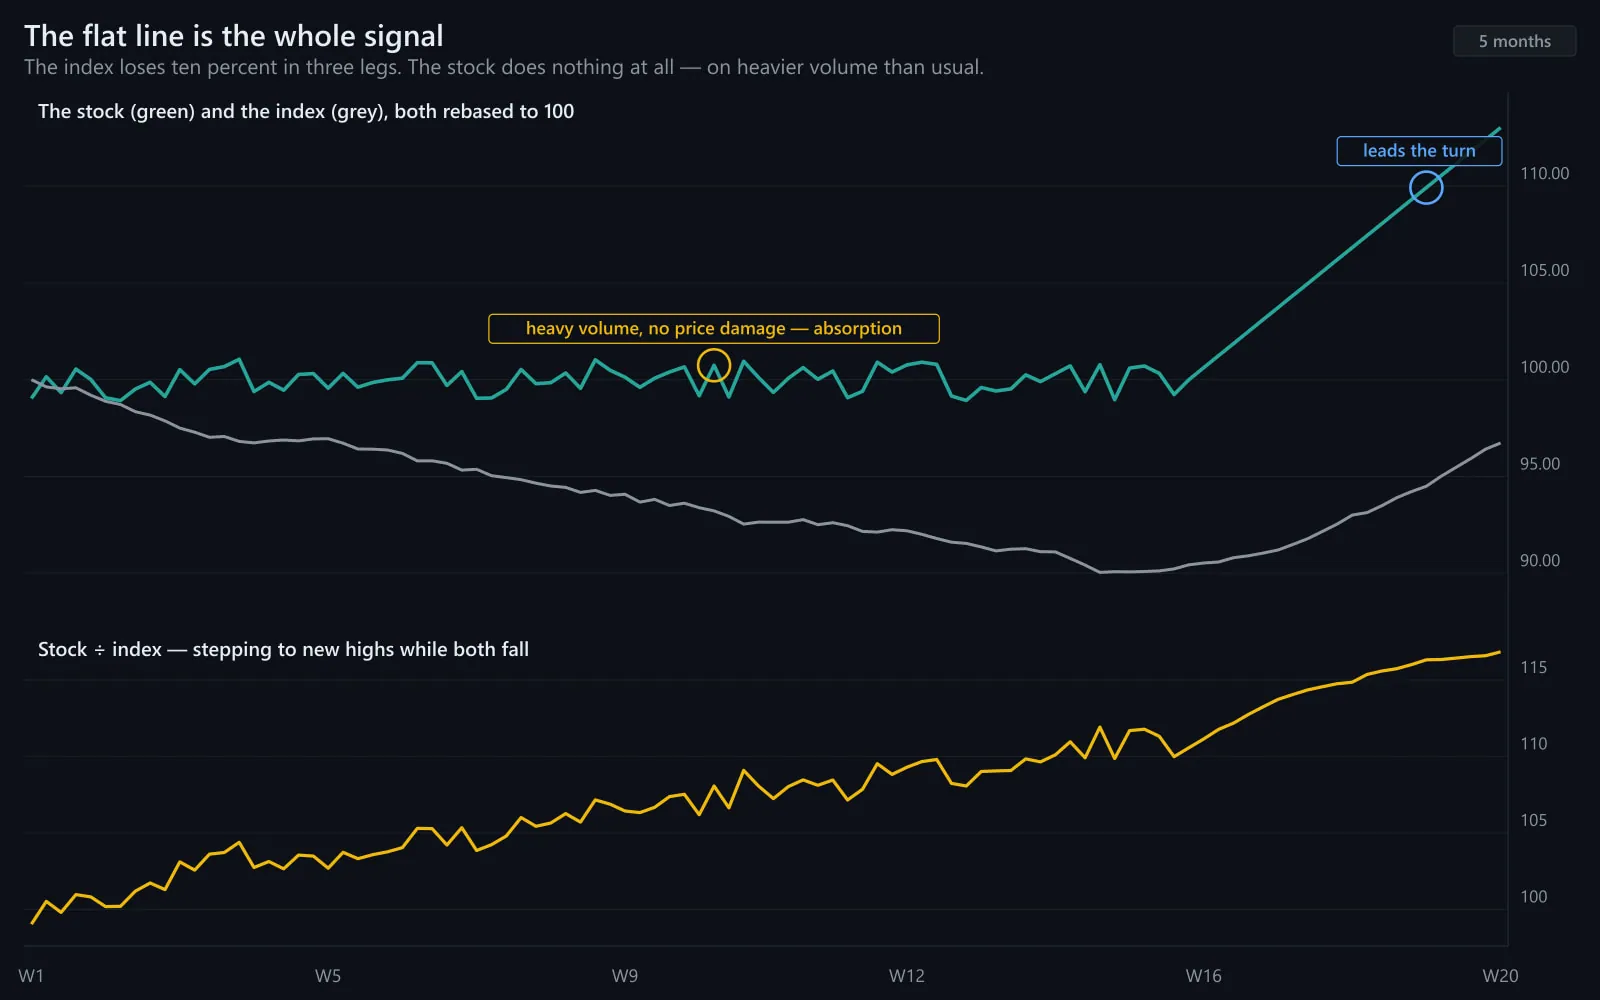
The signature: the index falls steadily; the stock goes sideways, holds its level, and its ratio makes new highs. When the index turns, such names are often among the first through their prior highs.
Illustrative. SPY (navy) declines; the stock (gold) holds flat — absorption.
Source: illustrative teaching data — not market data
06What weakness looks like
The false version: a stock that 'holds' for two days and then catches down with the rest. One or two sessions of divergence is noise; the signal is a stock that holds through the whole decline, or most of it, on visible volume.
Real
- Holds through most or all of the decline
- Ratio makes higher highs
- Absorption volume visible
- Tends to lead the index off the low
False
- Holds two days, then catches down
- Ratio spikes then collapses
- Thin volume
- Tends to lag the index off the low
Duration and volume decide.
Interpret · what it means for you
07What it means for an investor
For an investor the names that held through the last correction are worth researching: holding in weakness often reflects a business the market is reluctant to sell. It is a research list, not a buy list.
08What it means for a trader
For a trader this is one of the Advanced program's screens for long candidates. The list is built during the decline; a setup is considered only when the index turns and the candidate leads.
09What it cannot tell you
- It does not say the decline is over.
- A stock can hold for sector-specific reasons (a takeover bid) that say nothing about accumulation.
- In a panic, correlations rise and even the strongest names eventually get sold — briefly.
Apply · the market right now
10What is happening right now
MAAL TRADING ACADEMY market note
No dated note has been published for this topic yet. We only publish current-market commentary written and dated by the academy — nothing auto-generated.
Data · previous close
Live levels for SPY, QQQ appear here once the licensed market-data feed is connected. We do not show unlicensed or made-up numbers.
How to check this yourself today
- Find the last five-day stretch in which SPY fell more than 3%.
- List the stocks you follow that fell less than 1% or rose.
- Check whether their ratios to SPY made new highs in that stretch.
11Visual market example
A classic picture: a sell-off in the index, a stock that barely notices, and — when the index finally turns — the stock among the first to recover. The information was in the flat line.
Illustrative. Relative strength in weakness can be an early look at the next leaders.
Source: illustrative teaching data — not market data
Review · practise, keep, connect
12Test your understanding
Read the chart the way you would before a trade. Pick the answer, then read why.
1SPY falls 7% over two weeks. Stock A is −1% on rising volume and holds its 50-day average. Stock B is −9%. Which goes on the candidate list, and when would a setup be considered?
Illustrative.
Source: illustrative teaching data — not market data
13Key takeaways
- A stock that holds while the market falls is being accumulated against the tide.
- The list is built during the sell-off; setups are considered once the index turns and the name leads.
- Duration and volume separate real holders from late fallers.
- It identifies candidates; it does not say the decline is over.
15Learn it in class
Advanced Program · Stage 1 · Finding Stocks in Play
The Advanced candidate list for longs is built from the names that refused to fall in the last decline — this page is that screen.