
Understand · what it is and why it exists
01What it is
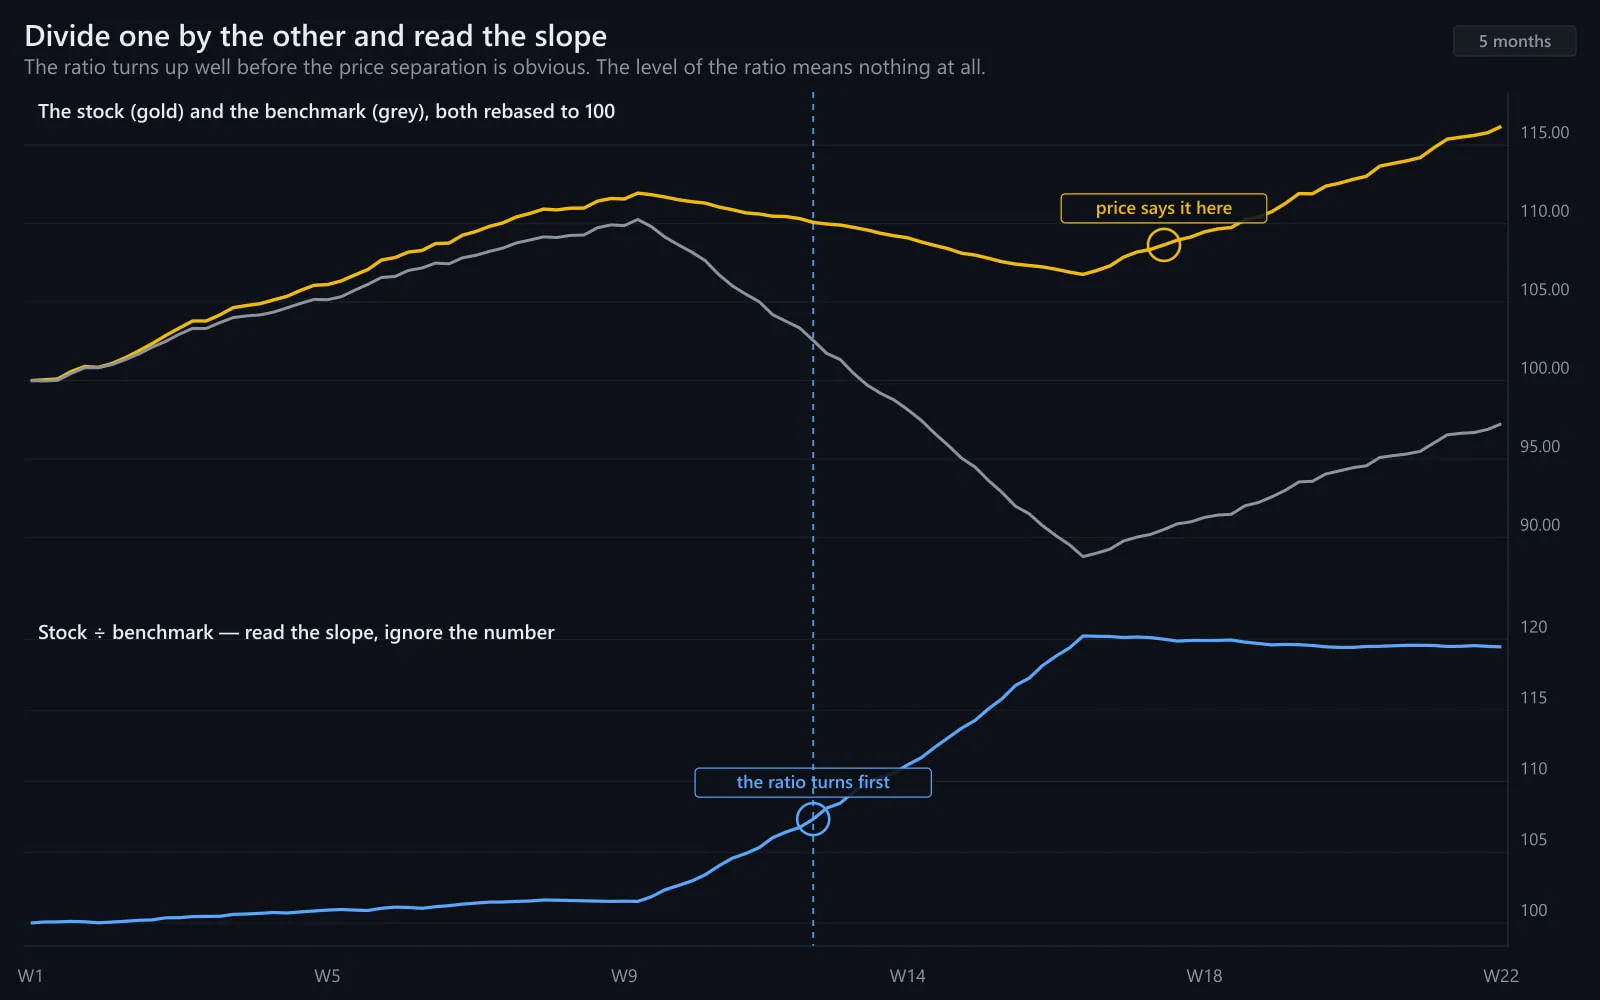
Stock-versus-SPY is the baseline relative-strength read: the stock's price divided by SPY's, plotted over time. When the ratio rises the stock is outperforming the broad market; when it falls it is underperforming. The level of the ratio means nothing; the slope and its changes mean everything.
It is the comparison to run first for any large, diversified company — industrials, financials, consumer names, healthcare — whose natural benchmark is the whole market rather than a growth index or a sector.
02Why it exists
It exists because SPY is the tide for most large stocks. Dividing by it removes the shared component and leaves the part of the move that is the stock's own. That residual is where information about the business and about who is accumulating it lives.
03How it is measured or observed
Three ways to see the same thing:
- Ratio chartStock ÷ SPY on any charting platform (usually typed as TICKER/SPY). Read the slope over the period you care about.
- Return differenceStock's return minus SPY's return over a day, week or month. +4% vs +1% = three points of relative strength.
- OverlayBoth on one chart, rebased to 100 at the start. The gap opening or closing is the ratio in picture form.
Read · seeing it in the market
04How professionals read it
Professionals read the ratio for turns. A ratio that has been falling for months and starts rising is a stock beginning to lead; the opposite is a leader beginning to fade. They confirm a turn over several weeks and then use it as a filter for which names to study, never as a signal on its own.
They also read the ratio at market turning points: which stocks' ratios held up in the last sell-off, and which collapsed in the last rally. Those two lists are where leaders and laggards are often found early.
05What strength looks like
A rising ratio: the stock pulls away from SPY over weeks, making relative highs before the index makes its own. The crowd is accumulating this name harder than the market.
Illustrative. The stock (gold) pulls away from SPY (navy) after the midpoint.
Source: illustrative teaching data — not market data
06What weakness looks like
A falling ratio: the stock lags every rally and leads every decline. It may still be rising in absolute terms — it is simply rising less than everything around it, which is a fact about demand for this name.
Illustrative. The stock (gold) falls behind the index (navy).
Source: illustrative teaching data — not market data
Interpret · what it means for you
07What it means for an investor
For an investor a multi-year ratio chart against SPY is the plainest answer to 'has this holding earned its place?' A ratio falling for years is a reason to re-read the thesis.
08What it means for a trader
For a trader the ratio is the first filter on a watchlist: rising ratios are studied as longs, falling ratios as shorts or set aside. The Advanced program's stocks-in-play screen is built on this comparison from the open.
09What it cannot tell you
- The ratio's level is meaningless; only the slope matters.
- A single day's ratio move can be news, not accumulation.
- The wrong benchmark (a growth stock against SPY instead of QQQ) produces false readings.
Apply · the market right now
10What is happening right now
MAAL TRADING ACADEMY market note
No dated note has been published for this topic yet. We only publish current-market commentary written and dated by the academy — nothing auto-generated.
Data · previous close
Live levels for SPY appear here once the licensed market-data feed is connected. We do not show unlicensed or made-up numbers.
How to check this yourself today
- Chart three stocks you follow as TICKER/SPY over six months.
- Mark where each ratio last changed direction.
- Check which held up best on the last market down day.
11Visual market example
The ratio turning in one picture: for a stretch the stock and SPY move together, then the stock begins to outperform — the ratio's slope changes before anything dramatic happens in price. That slope change is often an early sign that demand for the name is changing.
Illustrative. Same index, a stock that starts to lead.
Source: illustrative teaching data — not market data
Review · practise, keep, connect
12Test your understanding
Read the chart the way you would before a trade. Pick the answer, then read why.
1Over a month SPY is +3%. Stock A +3%. Stock B +7%. Stock C +1%. Rank their relative strength against SPY.
Illustrative.
Source: illustrative teaching data — not market data
13Key takeaways
- Stock ÷ SPY: read the slope, ignore the level.
- A turning ratio is often an early read on changing demand for a name.
- Confirm turns over weeks; use them as a filter, not a signal.
- Use SPY for broad, diversified companies; growth names belong against QQQ.
15Learn it in class
Advanced Program · Stage 1 · Finding Stocks in Play
The Advanced watchlist is ranked by relative strength against SPY from the open — this comparison is the first column.