
Understand · what it is and why it exists
01What it is
Relative strength compares a stock's performance with something else — the index, a sector, another stock. It is a ratio or a return difference, read over a chosen period, with no fixed scale.
The Relative Strength Index (RSI) is a momentum oscillator invented in 1978. It compares the size of a stock's recent up-days with its recent down-days and scales the result from 0 to 100. It looks only at the stock itself; no benchmark is involved. Readings above 70 are conventionally called 'overbought' and below 30 'oversold'.
They share initials by historical accident. They answer different questions and frequently disagree.
02Why it exists
The confusion exists because 'RSI' is on every charting platform and 'relative strength' is in every trading book, and both get abbreviated. The cost is real: a trader told that a stock 'has strong relative strength' because its RSI is 78 has been told nothing about how it compares with the market — and may have been told it is overextended.
03How it is measured or observed
Side by side:
- Relative strengthStock ÷ benchmark, or stock return − benchmark return. No scale; read the slope. Period is whatever you choose.
- RSI100 − 100 / (1 + average gain ÷ average loss) over 14 periods by default. Scale 0–100. Measures the stock's own recent momentum.
- Where they agreeA stock rallying hard can have both a rising ratio and a high RSI. The agreement is coincidental.
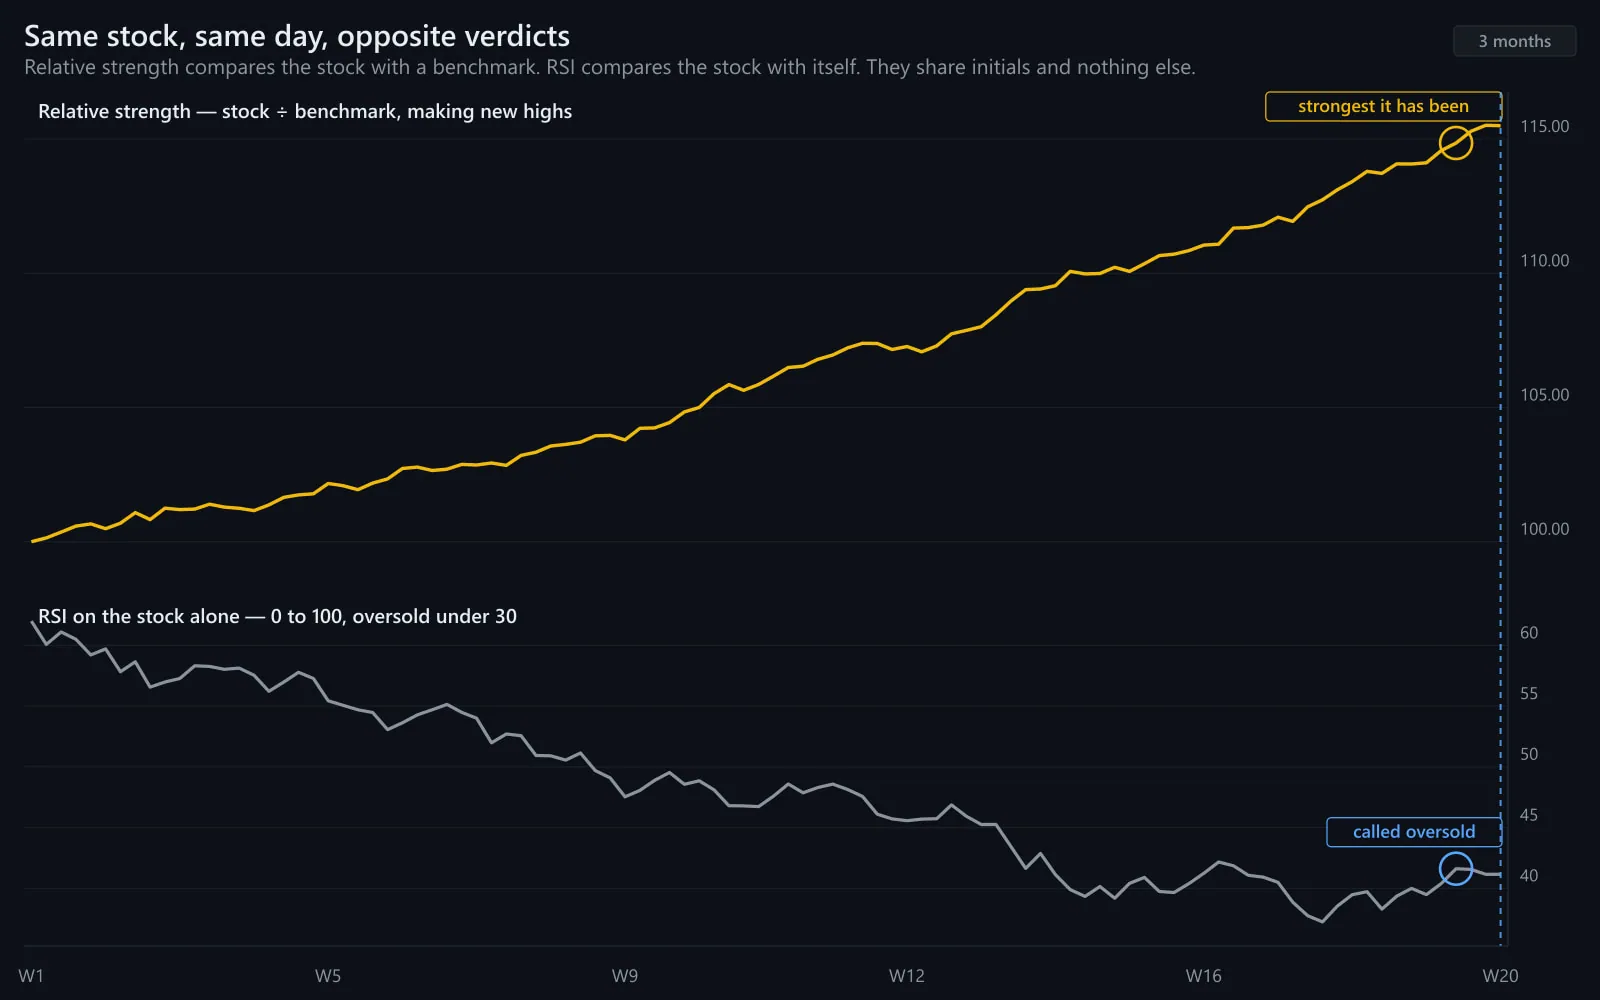
- Where they disagreeA stock falling less than a crashing market: rising relative strength, low RSI. A stock rising less than a booming market: falling relative strength, high RSI.
Read · seeing it in the market
04How professionals read it
Professionals use the two for different jobs. Relative strength picks the stock (see the previous lesson). RSI, where it is used at all, describes the stock's own short-term momentum — and many experienced traders treat its 'overbought' label with suspicion, because strong stocks in strong trends can stay above 70 for weeks.
The one thing they never do is substitute one for the other. 'RSI is high, so it has relative strength' and 'RSI is low, so it is weak' are both errors, and both are common.
05What strength looks like
The two agreeing: a stock leading the market in a rally, ratio rising, RSI elevated. Both readings happen to be true at once — but only the ratio says anything about the market.
Relative strength
- Stock versus a benchmark
- Ratio line or return difference
- No fixed scale; read the slope
- Answers: is this name being accumulated harder than the market?
RSI (indicator)
- Stock versus itself
- Oscillator, 0–100
- 'Overbought' above 70, 'oversold' below 30
- Answers: how fast has this name moved recently?
Same initials, different questions.
06What weakness looks like
The two disagreeing — the case that matters: a market down 15%, a stock down 4%. Its relative strength is excellent (it fell far less). Its RSI is low (it fell). A trader reading RSI would call it weak; a trader reading relative strength would put it on the candidate list. Only the second has compared the stock with the market.
Illustrative. Relative strength high, RSI low — and the relative-strength reading is the useful one.
Source: illustrative teaching data — not market data
Interpret · what it means for you
07What it means for an investor
For an investor RSI is largely irrelevant and relative strength is a research tool. If a platform shows 'RS' next to a stock, check which one it means before drawing any conclusion.
08What it means for a trader
For a trader the distinction is basic literacy. The Advanced program uses relative strength for selection and reads momentum from price action, volume and tape rather than from an oscillator. When RSI appears in a student's plan, the first question is whether they meant relative strength.
09What it cannot tell you
- RSI says nothing about the market or the sector.
- Relative strength says nothing about whether a stock is 'overbought'.
- Neither is a signal on its own.
Apply · the market right now
10What is happening right now
MAAL TRADING ACADEMY market note
No dated note has been published for this topic yet. We only publish current-market commentary written and dated by the academy — nothing auto-generated.
Data · previous close
Live levels for SPY appear here once the licensed market-data feed is connected. We do not show unlicensed or made-up numbers.
How to check this yourself today
- Pick a stock. Chart its ratio to SPY and, separately, its 14-day RSI.
- Find a period where one rose and the other fell.
- Ask which reading would have been useful at that moment.
11Visual market example
The disagreement case in numbers: a market down 15%, a stock down 4%, RSI 32. Two words, two answers. The one that compares the stock with the world is the one that describes what the world thinks of the stock.
Illustrative.
Source: illustrative teaching data — not market data
Review · practise, keep, connect
12Test your understanding
Read the chart the way you would before a trade. Pick the answer, then read why.
1A colleague says: 'This stock has an RSI of 82 — strong relative strength, but overbought.' What is wrong with the sentence?
Illustrative.
Source: illustrative teaching data — not market data
13Key takeaways
- Relative strength: stock versus benchmark. RSI: stock versus itself.
- They share initials and nothing else; they often disagree.
- A stock falling less than a crashing market has high relative strength and a low RSI — and the first reading is the useful one.
- Check which 'RS' a platform means before concluding anything.
15Learn it in class
Advanced Program · Stage 2 · Advanced Orders & Level II / Tape
The Advanced program reads momentum from price action, volume and tape, not from an oscillator — and 'did you mean relative strength?' is a question the instructor asks often.