
Understand · what it is and why it exists
01What it is
Relative weakness during rallies is the mirror of the previous lesson: the index rises and a stock does not follow. It chops, fades, or falls while everything else is bought. A rising tide lifts most boats; one that stays down is taking on water.
It may look harmless. Flat in a rally is the whole signal.
02Why it exists
It exists because rallies are also indiscriminate: index buying lifts every member, and optimism buys everything. A stock that cannot rise through that has supply overhead — holders using every bounce to exit. When the tide turns, that supply is often still there, with little holding the price up.
03How it is measured or observed
What to look for while the market rises:
- Flat or falling price during an index advanceOverlay the stock and SPY; the gap opening the wrong way.
- Ratio making new lowsStock ÷ SPY falling while both rise in absolute terms.
- Failing at levels the index clearsThe stock rejected at its 50-day while SPY breaks out above its own.
- Rallies soldUp days closed near the low; every bounce met with volume.
Read · seeing it in the market
04How professionals read it
Professionals keep the mirror list during every rally: the names that could not get up. It is their short-candidate set for when the index stalls, and a caution list for longs.
They wait for the index to stop rising before acting. Relative weakness in a rally identifies a stock with overhead supply; it does not say the rally is over. A short setup is considered only when the market stalls and the candidate breaks first.
05What strength looks like
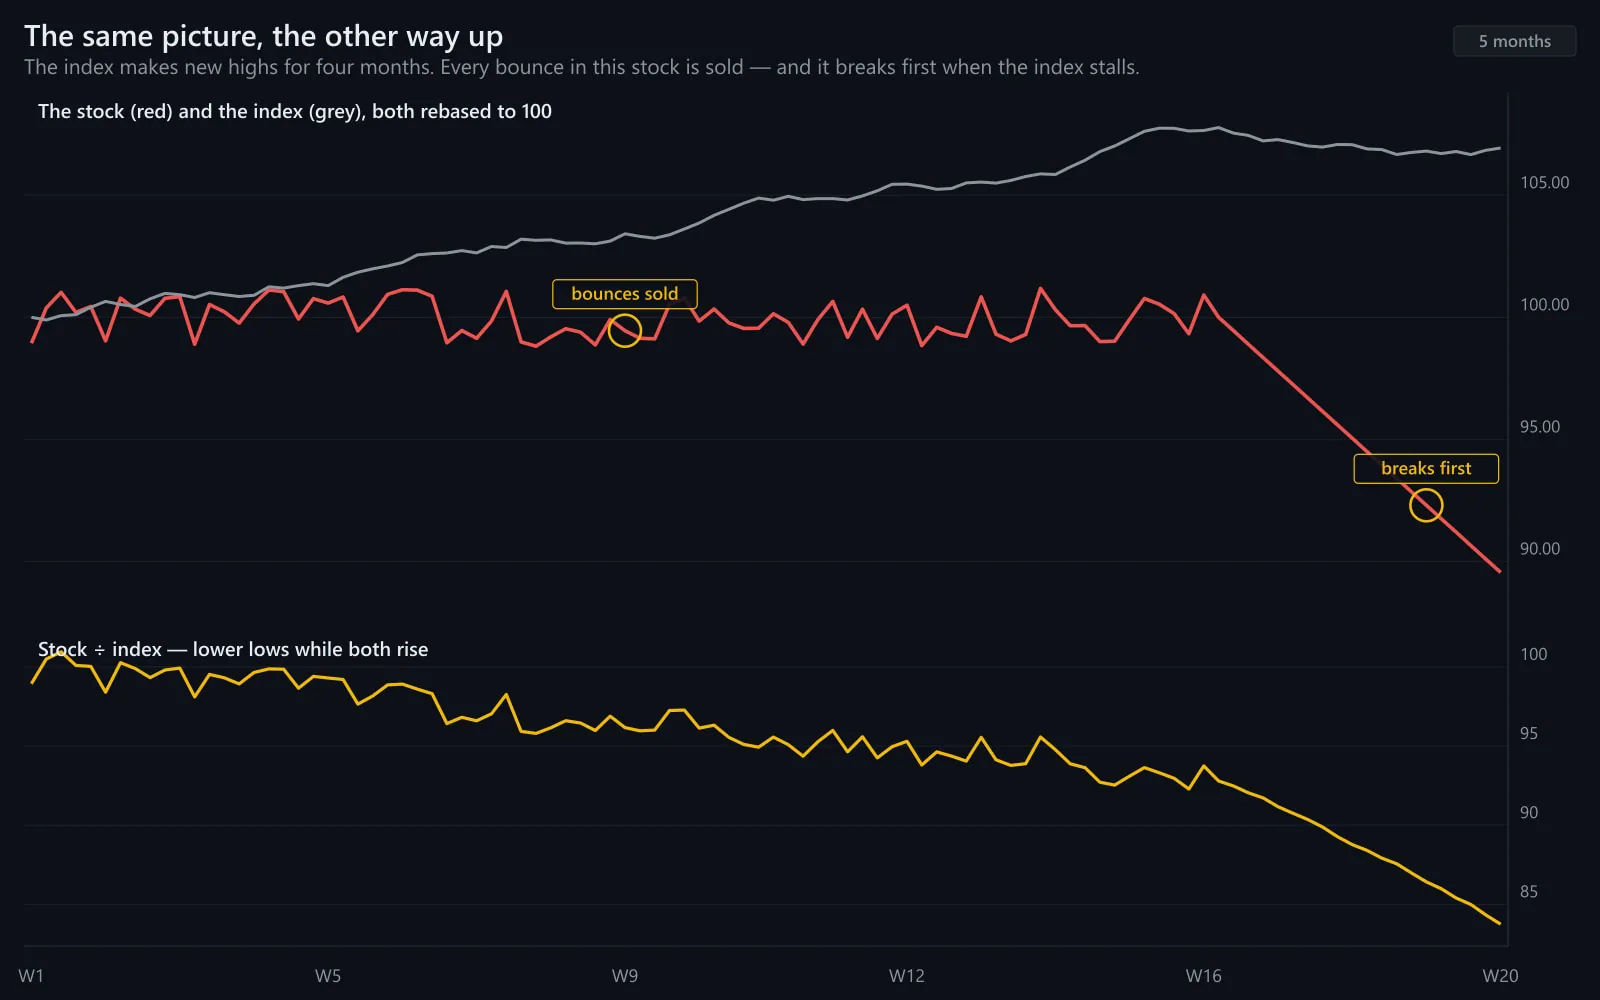
The signature: the index climbs; the stock fails to follow, rolls over at resistance, and its ratio makes new lows. When the index stalls, such names are often among the first through their prior lows.
Illustrative. SPY (navy) rises; the stock (gold) cannot — supply overhead.
Source: illustrative teaching data — not market data
06What weakness looks like
The false version: a stock that lags for two sessions on an earnings-related pause and then catches up. As always, duration and volume distinguish a real laggard from a brief one.
Held in weakness (strong list)
- Flat while index fell
- Ratio higher highs
- Absorption volume
- Tends to lead the turn up
Lagged in strength (weak list)
- Flat while index rose
- Ratio lower lows
- Rallies sold on volume
- Tends to lead the turn down
Built during the market's move, studied for setups at the turn.
Interpret · what it means for you
07What it means for an investor
For an investor a holding that cannot rise in a broad rally is a thesis to revisit — something is keeping sellers active. The lesson is not 'sell'; it is 'find out why'.
08What it means for a trader
For a trader this is the Advanced short-candidate screen and a caution list for longs. A long setup in a name on this list is fighting visible supply, however good the pattern.
09What it cannot tell you
- It does not say the rally is over.
- A stock can lag for a one-off reason (dilution, a lawsuit) that is already priced.
- In a melt-up, even weak names eventually get dragged up — briefly.
Apply · the market right now
10What is happening right now
MAAL TRADING ACADEMY market note
No dated note has been published for this topic yet. We only publish current-market commentary written and dated by the academy — nothing auto-generated.
Data · previous close
Live levels for SPY, QQQ appear here once the licensed market-data feed is connected. We do not show unlicensed or made-up numbers.
How to check this yourself today
- Find the last five-day stretch in which SPY rose more than 3%.
- List the stocks you follow that were flat or down.
- Check whether their ratios to SPY made new lows.
11Visual market example
The mirror picture: a rally in the index, a stock that cannot participate, and — when the index stalls — the stock among the first to break down. The information was in the flat line, the other way up.
Illustrative. Relative weakness in strength can be an early look at the next laggards.
Source: illustrative teaching data — not market data
Review · practise, keep, connect
12Test your understanding
Read the chart the way you would before a trade. Pick the answer, then read why.
1SPY rises 6% in two weeks. Stock A is flat with each up day closing near its low on heavy volume. A bullish pattern appears on A. How is it read?
Illustrative.
Source: illustrative teaching data — not market data
13Key takeaways
- A stock that cannot rise while the market rallies has supply overhead.
- The list is built during the rally; short setups are considered once the index stalls.
- It is a caution list for longs, whatever the chart pattern.
- Duration and volume separate real laggards from brief pauses.
15Learn it in class
Advanced Program · Stage 1 · Finding Stocks in Play · Stage 6 · Executing Reversals
The Advanced short-candidate list is built from names that could not rally — and the class's reversal framework requires actual structure, never 'it went up too much'.