
Understand · what it is and why it exists
01What it is
Stock-versus-QQQ is the relative-strength read for growth and technology names: the stock divided by the Nasdaq-100 ETF. A software company or chip designer that 'beats SPY' has usually just ridden the growth tide; the question is whether it beat its own tide, and QQQ is that tide.
The benchmark choice matters because correlation is higher within a style than across the market. Growth names move with QQQ more than with SPY; measuring them against SPY mixes the growth-versus-value effect into the reading and hides what the stock itself is doing.
02Why it exists
It exists because the market has styles, and a stock's relative strength is only meaningful against the style it belongs to. On a day growth leads, every growth stock 'beats SPY' — that is not relative strength, it is the style. Against QQQ, the style is removed and the stock remains.
03How it is measured or observed
Same tools, different denominator:
- TICKER/QQQ ratioThe stock divided by QQQ. Rising = leading the growth tide.
- Sector or industry ETF as a second checkA chip designer against the semiconductor ETF; a software name against a software ETF. One level more precise than QQQ.
- QQQ vs SPY alongsideKnow whether the growth tide itself is rising or falling — the stock's reading sits inside it.
Read · seeing it in the market
04How professionals read it
Professionals read a growth stock against QQQ first and against its industry second. A stock leading both is a genuine leader; one leading SPY but lagging QQQ is simply a passenger on the growth tide; one lagging QQQ while QQQ leads is a warning inside a strong style.
They are especially attentive when QQQ is falling. A growth name that holds while QQQ sells off is being accumulated against its own tide — the strongest form of relative strength a growth stock can show.
05What strength looks like
Leading the growth tide: the stock outpaces QQQ while QQQ outpaces SPY. Two tides and a leader on top of them.
Illustrative. The stock (gold) outpaces QQQ (blue), which outpaces SPY (navy).
Source: illustrative teaching data — not market data
06What weakness looks like
Lagging the growth tide: the stock beats SPY (it is a growth name in a growth market) but falls behind QQQ. Against the right benchmark, it is weak — and the SPY comparison would have hidden it.
Illustrative. The stock (gold) is above SPY (navy) and below QQQ (blue) — weak against its own tide.
Source: illustrative teaching data — not market data
Interpret · what it means for you
07What it means for an investor
For an investor the QQQ comparison is how to tell a growth holding that is earning its place from one that is merely in a favoured style. Years of lagging QQQ inside a growth rally is a thesis to revisit.
08What it means for a trader
For a trader a growth name is read against QQQ before every entry; the Advanced screen puts them side by side. A breakout in a software stock on a day QQQ is losing VWAP has no tide behind it, whatever SPY is doing.
09What it cannot tell you
- It says nothing about value stocks or financials — wrong benchmark.
- QQQ's own concentration means 'the growth tide' is partly three companies.
- Relative strength against QQQ can reverse with the style itself.
Apply · the market right now
10What is happening right now
MAAL TRADING ACADEMY market note
No dated note has been published for this topic yet. We only publish current-market commentary written and dated by the academy — nothing auto-generated.
Data · previous close
Live levels for QQQ, SPY appear here once the licensed market-data feed is connected. We do not show unlicensed or made-up numbers.
How to check this yourself today
- Chart a growth stock you follow as TICKER/QQQ and as TICKER/SPY over three months. Do they agree?
- Chart QQQ/SPY to know which way the growth tide is running.
- On the last day QQQ fell, did the stock fall less?
11Visual market example
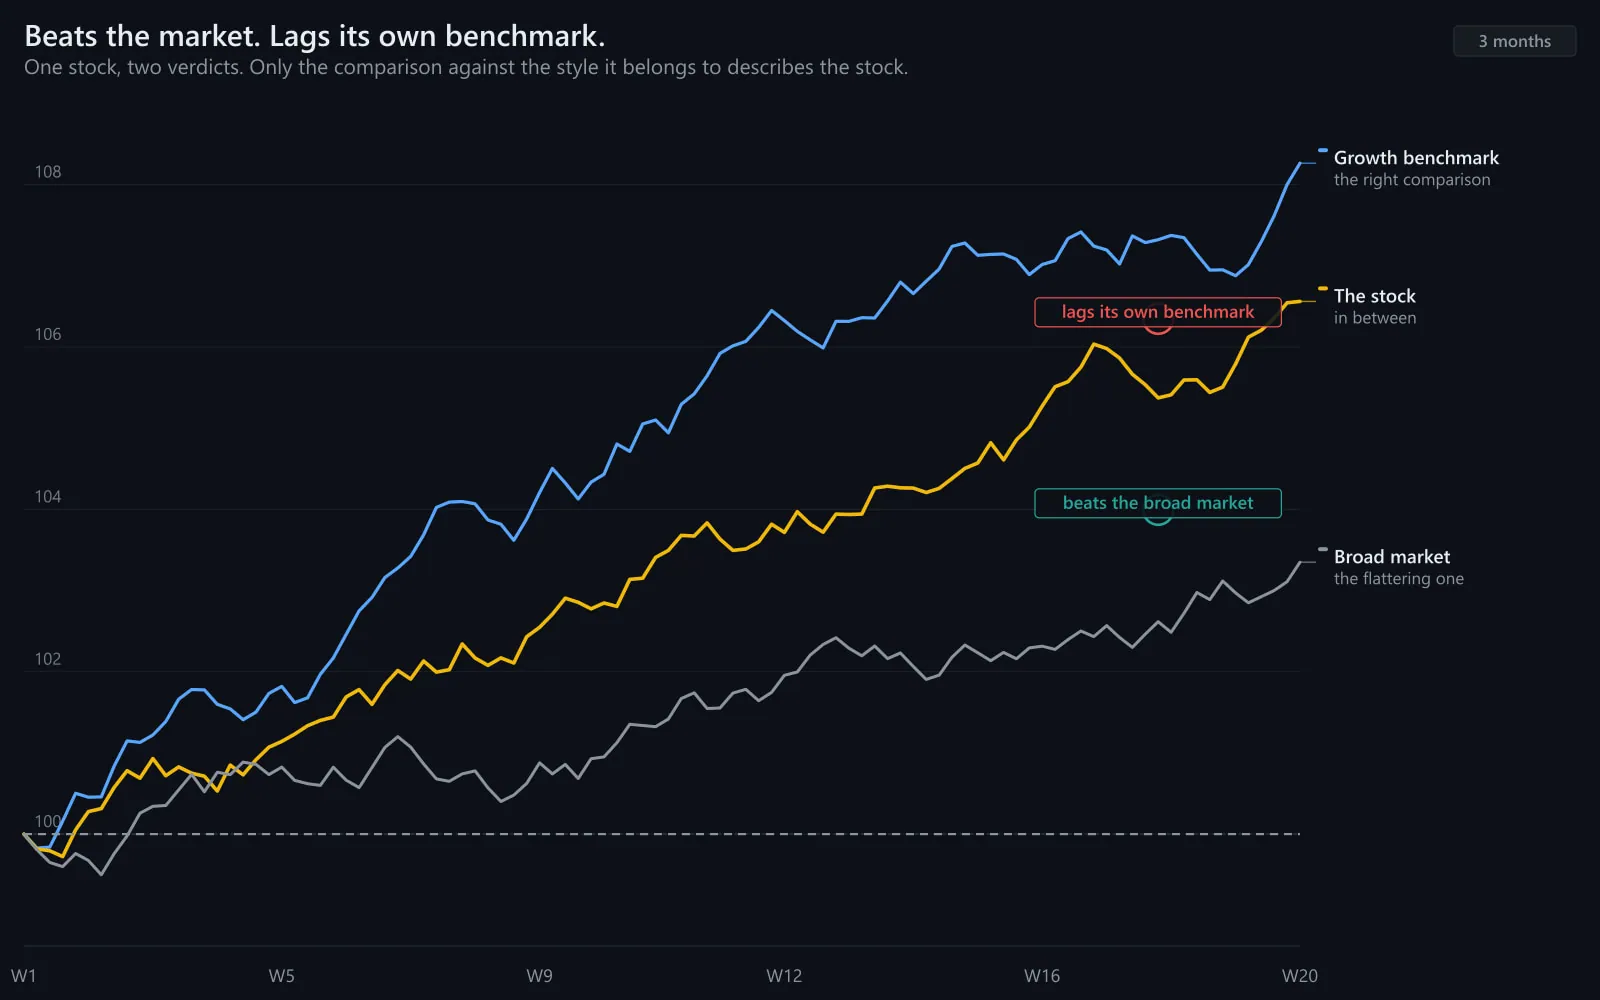
The same stock against two benchmarks: a winner against SPY, a laggard against QQQ. Only one of those readings describes the stock; the other describes the style. Choosing the benchmark is choosing whether you learn anything.
Illustrative. Against SPY it leads; against QQQ it lags.
Source: illustrative teaching data — not market data
Review · practise, keep, connect
12Test your understanding
Read the chart the way you would before a trade. Pick the answer, then read why.
1A chip stock is +6% on the month. QQQ +9%. SPY +3%. SMH (semiconductors) +11%. How strong is the stock?
Illustrative.
Source: illustrative teaching data — not market data
13Key takeaways
- Growth names are read against QQQ, not SPY; the style is removed and the stock remains.
- Leading SPY while lagging QQQ is riding the tide, not leading it.
- Holding while QQQ falls is the strongest read a growth stock can give.
- Go one level more precise with the industry ETF.
15Learn it in class
Advanced Program · Stage 1 · Finding Stocks in Play
Every growth name on the Advanced watchlist is read against QQQ first, then its industry ETF, then SPY — in that order.