
Understand · what it is and why it exists
01What it is
Volatility is the size of price movement. Volume is the number of shares traded. They are often high together — big moves attract participation — but they are independent measures, and the cases where they disagree are the informative ones.
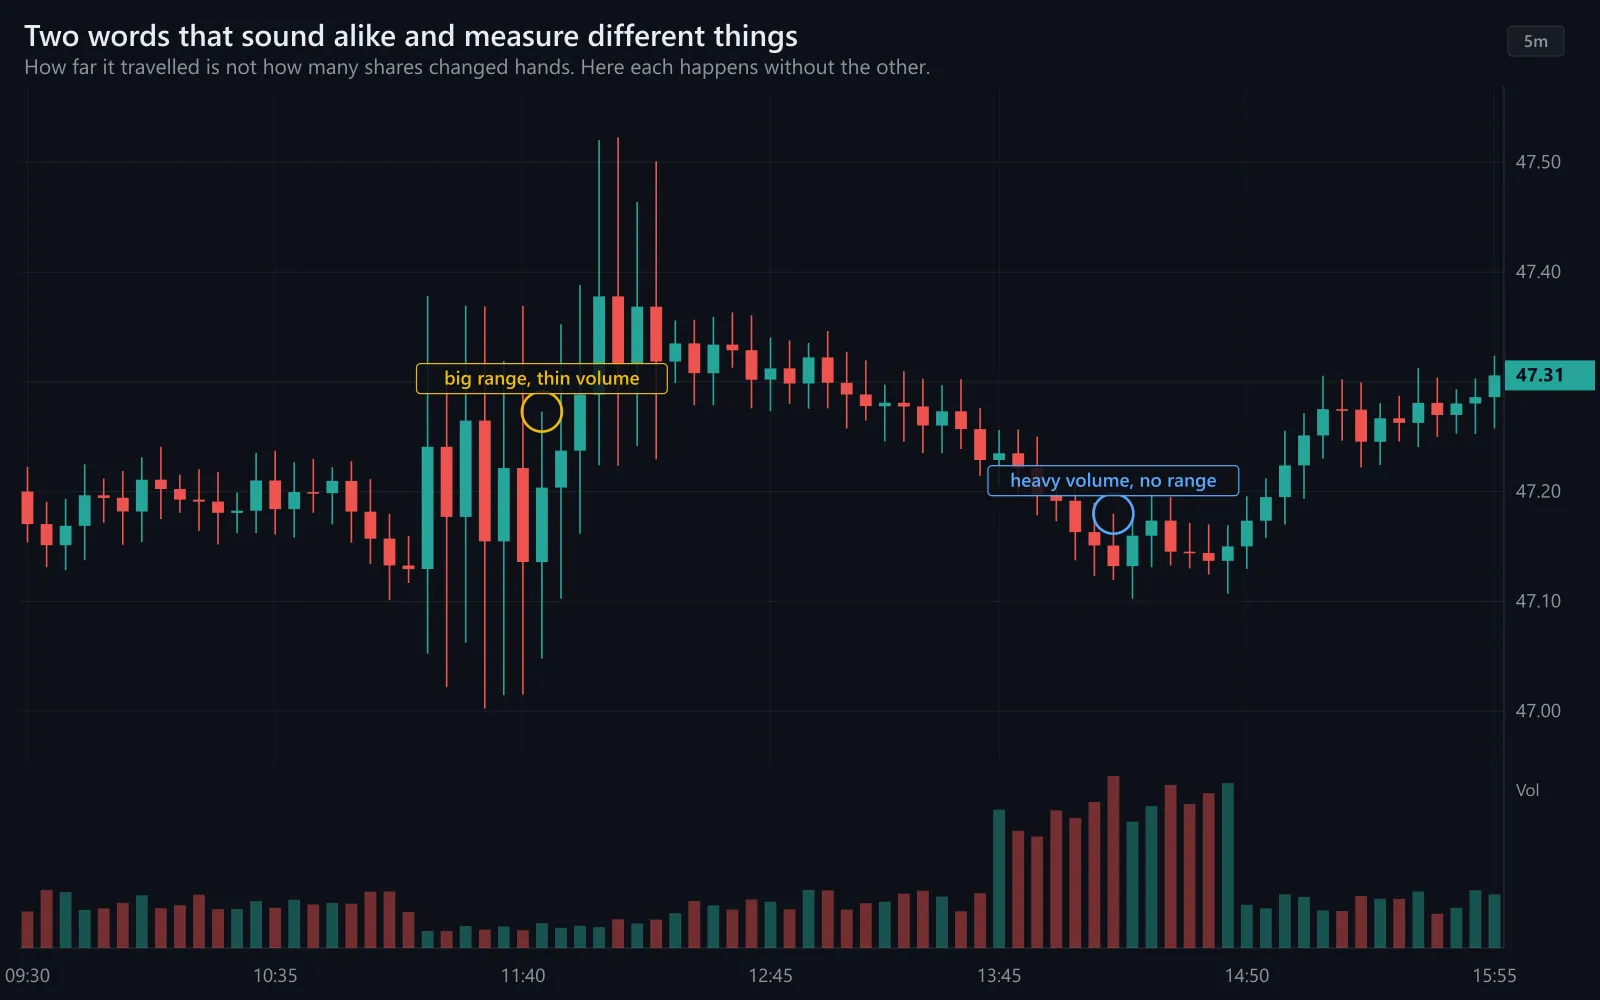
High volatility on low volume is a thin market being pushed around: few participants, large moves, little conviction. High volume on low volatility is a battle: many participants, price barely moving, a decision being contested. Each combination describes a different market.
02Why it exists
The distinction exists because price can move for two reasons: because many participants agree on a new level (volume confirms), or because few participants are present and a handful of orders move the price (volume does not). The first kind of move tends to persist; the second tends to reverse. Volume is how you tell them apart.
03How it is measured or observed
Read them as a pair:
- Range × volumeA big bar on big volume = conviction. A big bar on thin volume = suspicion. A small bar on huge volume = absorption (someone is soaking up supply or demand at that price).
- Relative volumeToday's volume versus the 20-day average at the same time of day. 'High' means relative to normal, not an absolute number.
- Volume at levelsHeavy volume at a level that holds = a defended level. Heavy volume at a level that breaks = a decisive break.
- Volume trend inside a rangeDeclining volume in a contraction is normal; a sudden volume surge inside the range often precedes the break.
- Time-of-day baselineVolume is U-shaped across the session; compare to the same window on normal days, not to the whole day.
Read · seeing it in the market
04How professionals read it
Professionals read volume as the credibility of a price move. The same 4% bar means two different things on five times average volume and on half of it. Before they act on any expansion bar, level break or reversal, they look at the volume beneath it.
They pay particular attention to absorption: heavy volume with little price change at a level. It means one side is meeting the other's supply or demand and holding the line — often the quietest signal of the strongest hand in the market.
And they know that volatility without volume is the signature of the midday lull and of thin, holiday-week markets — the conditions in which apparent breakouts often fail.
05What strength looks like
Agreement: a large move on large volume. Many participants, one direction, a new level accepted. The move has credibility, and follow-through is the more common reading.
High volume
- High volatility — conviction
- Low volatility — absorption / battle
Low volume
- High volatility — thin, suspect
- Low volatility — nothing happening
Read the pair, not either alone.
06What weakness looks like
Disagreement: a large move on thin volume. Few participants were present; the price was pushed rather than accepted. These moves often reverse — and they are exactly what a midday 'breakout' on a quiet day looks like.
Credible
- Range expansion on above-normal relative volume
- Level broken on heavy volume and held
- Absorption at a level (heavy volume, little movement) followed by a move away
Suspect
- Big bar on half-normal volume
- Midday or holiday-week breakout
- Level broken on thin volume and quickly reclaimed
Volume decides.
Interpret · what it means for you
07What it means for an investor
For an investor volume matters mainly for execution: thin markets have wide spreads and erratic prices, which is where limit orders earn their keep. A long-term holder rarely needs to read volume otherwise.
08What it means for a trader
For a trader volume is the confirmation column in every setup. The Advanced framework reads price action, volume, Level II and tape together; within it, a breakout without volume is not a valid setup, and 'no valid setup, no trade' applies.
09What it cannot tell you
- Volume does not say who is buying or selling; it says how many shares changed hands.
- High volume at a top or bottom can mean climax as easily as continuation; context decides.
- Absolute volume means nothing without a baseline.
Apply · the market right now
10What is happening right now
MAAL TRADING ACADEMY market note
No dated note has been published for this topic yet. We only publish current-market commentary written and dated by the academy — nothing auto-generated.
Data · previous close
Live levels for SPY, QQQ appear here once the licensed market-data feed is connected. We do not show unlicensed or made-up numbers.
How to check this yourself today
- On SPY, compare today's volume with its 20-day average at the same time of day.
- Find the last big bar and check its relative volume.
- Look for a level where volume was heavy and price barely moved — absorption.
11Visual market example
The four combinations in one picture. Only one of them — movement with participation — is usually read as credible on its own. The other three each carry a different, specific message, and reading them is a large part of what 'reading the tape' means.
Carries information
- Move + volume — participation behind the price
- No move, heavy volume — absorption at a level
Treat with suspicion
- Move, no volume — thin and easily reversed
- Neither — nothing happening
A teaching description — not a score and not a statistic.
Review · practise, keep, connect
12Test your understanding
Read the chart the way you would before a trade. Pick the answer, then read why.
1At 12:20 PM a stock breaks a key level by 0.5% on volume that is 40% of its usual pace. What is the read?
Illustrative.
Source: illustrative teaching data — not market data
13Key takeaways
- Volatility is how far; volume is how many. They are independent.
- Volume is the credibility of a move: expansion on volume tends to persist; expansion without it often reverses.
- Absorption — heavy volume, little movement — is a quiet sign of a strong hand.
- Always read relative volume against the time-of-day baseline.
15Learn it in class
Advanced Program · Stage 2 · Advanced Orders & Level II / Tape
Advanced Day 1: the tape — speed, size, and whether volume confirms the price. Price action + volume + Level II + tape, never price alone.