
Understand · what it is and why it exists
01What it is
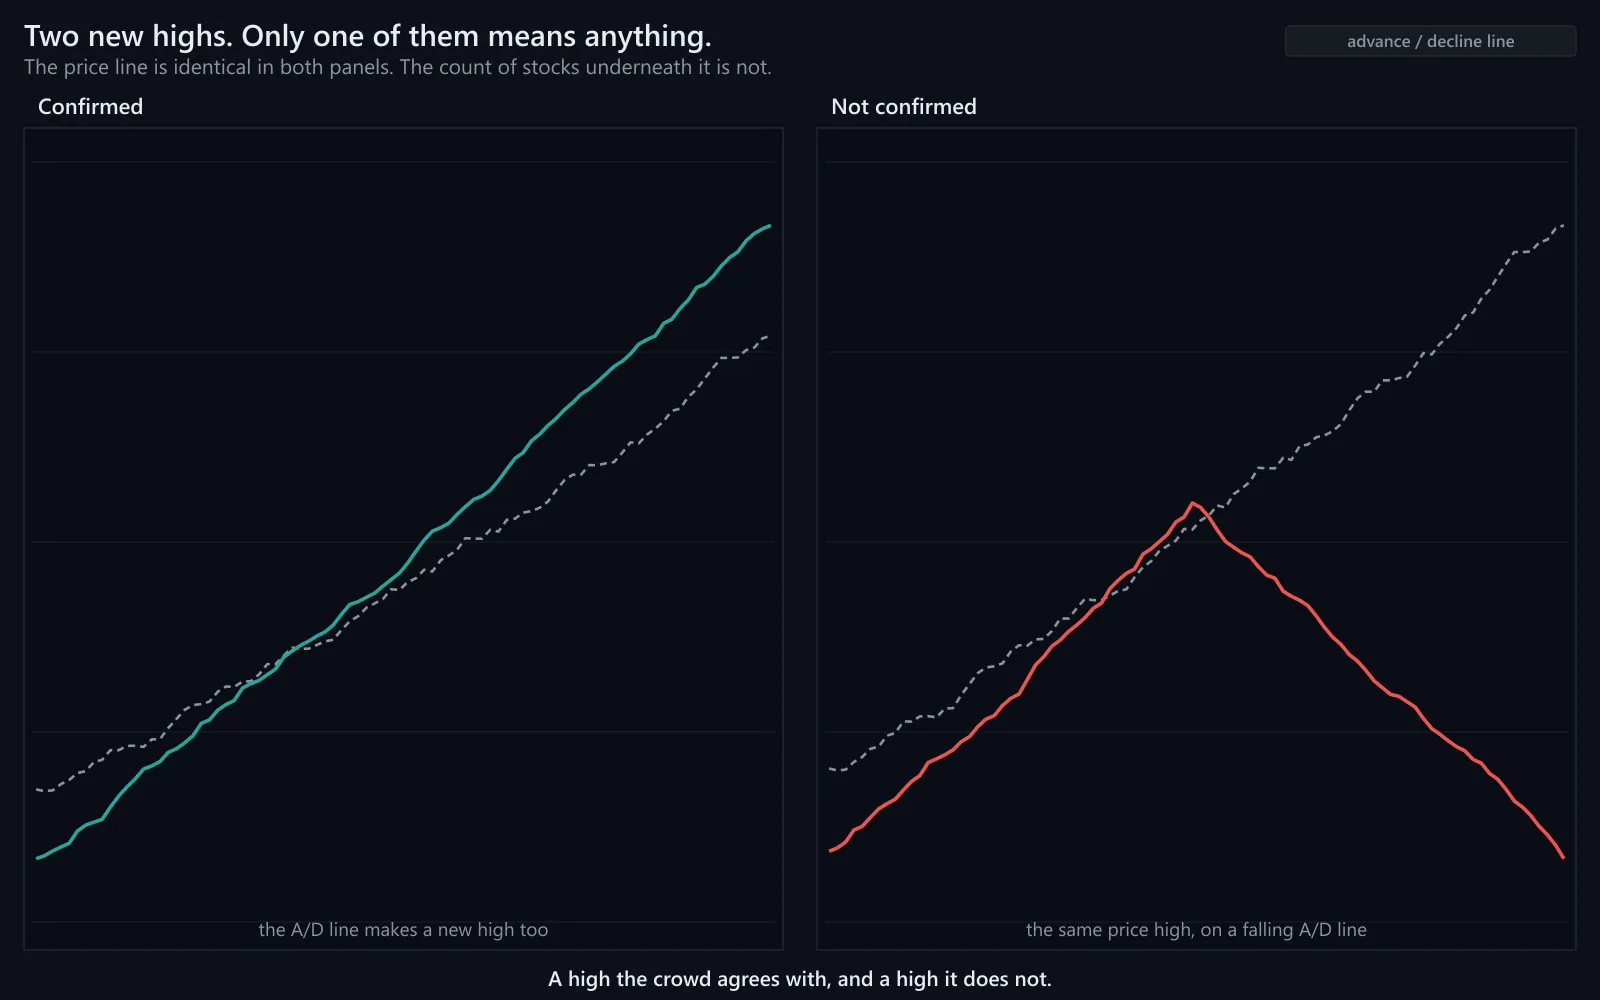
Breadth confirmation is the test applied at every new index high: did participation make a new high too? The advance/decline line, the percent of stocks above their 200-day average, the number of new 52-week highs — if those confirm, the crowd agrees with the index. If they do not, the high is narrow.
It is the leadership cluster's version of the Market Breadth article: the specific moment, the new high, when breadth is most informative.
02Why it exists
It exists because index highs are made by weighted prices, and weighted prices can be carried by a few names. Confirmation asks the rest of the market to vote. Highs with broad confirmation are commonly read as more durable than highs without — not a rule, but reason enough to make the check worth thirty seconds.
03How it is measured or observed
At the new high, check:
- Advance/decline lineDid it also make a new high?
- Percent above 200-dayIs it near its own recent highs, or well below?
- New highs vs new lowsAre new highs expanding and new lows scarce?
- Equal-weight and small capsRSP and IWM near their own highs?
Read · seeing it in the market
04How professionals read it
Professionals run the check and then hold it lightly. A confirmed high raises confidence; an unconfirmed one raises the cost of being wrong. Neither is a trigger. The unconfirmed high becomes meaningful when it repeats — a series of index highs with breadth making lower highs each time is the classic narrowing pattern.
They also apply it in reverse at new lows: an index low that fewer stocks participate in (new lows contracting, A/D line holding above its prior low) is a sign the selling is exhausting.
05What strength looks like
A confirmed high: the index and the A/D line make new highs together; percent above the 200-day is high; new highs expand. The crowd agrees.
Illustrative. SPY (navy) and the A/D line (gold) make highs together.
Source: illustrative teaching data — not market data
06What weakness looks like
An unconfirmed high: the index makes a new high; the A/D line makes a lower high; percent above the 200-day falls; new lows creep up. The giants agree with the index; the crowd does not.
Illustrative. SPY (navy) at a high; the A/D line (gold) rolling over — divergence.
Source: illustrative teaching data — not market data
Interpret · what it means for you
07What it means for an investor
For an investor the check is context: an unconfirmed high is a concentrated market, which is worth knowing about a holding, not necessarily worth acting on.
08What it means for a trader
For a trader a confirmed high is an environment in which breakouts have the crowd behind them; an unconfirmed one is an environment in which they tend to struggle. It feeds the day's size and setup selection.
09What it cannot tell you
- Unconfirmed highs can persist for months; the check is not a timer.
- Breadth measures disagree with each other; mixed is a valid reading.
- A single confirmed or unconfirmed high is weak evidence; a series is stronger.
Apply · the market right now
10What is happening right now
MAAL TRADING ACADEMY market note
No dated note has been published for this topic yet. We only publish current-market commentary written and dated by the academy — nothing auto-generated.
Data · previous close
Live levels for SPY, RSP, IWM appear here once the licensed market-data feed is connected. We do not show unlicensed or made-up numbers.
How to check this yourself today
- Find SPY's most recent high.
- Check whether the NYSE A/D line made a high in the same week.
- Compare the percent of S&P stocks above their 200-day with its level at the prior high.
11Visual market example
Confirmed, then not: the first highs are joined by breadth; later ones are not. The index chart is a single rising line. The confirmation check is the only thing that distinguishes its two halves.
Illustrative. Agreement early; divergence late.
Source: illustrative teaching data — not market data
Review · practise, keep, connect
12Test your understanding
Read the chart the way you would before a trade. Pick the answer, then read why.
1SPY makes a third consecutive new high. The A/D line has made a lower high at each one. Percent above the 200-day has fallen from 78% to 52%. What does the check say?
Illustrative.
Source: illustrative teaching data — not market data
13Key takeaways
- At every new high, ask whether breadth made a new high too.
- Confirmed highs tend to be more durable; unconfirmed ones are more fragile.
- A series of unconfirmed highs is the narrowing pattern.
- The check applies in reverse at lows: contracting new lows suggest exhaustion.
15Learn it in class
Advanced Program · Stage 1 · Finding Stocks in Play
Breadth confirmation is part of the Advanced morning check — an unconfirmed index high lowers the size the class will give any breakout that day.