
Understand · what it is and why it exists
01What it is
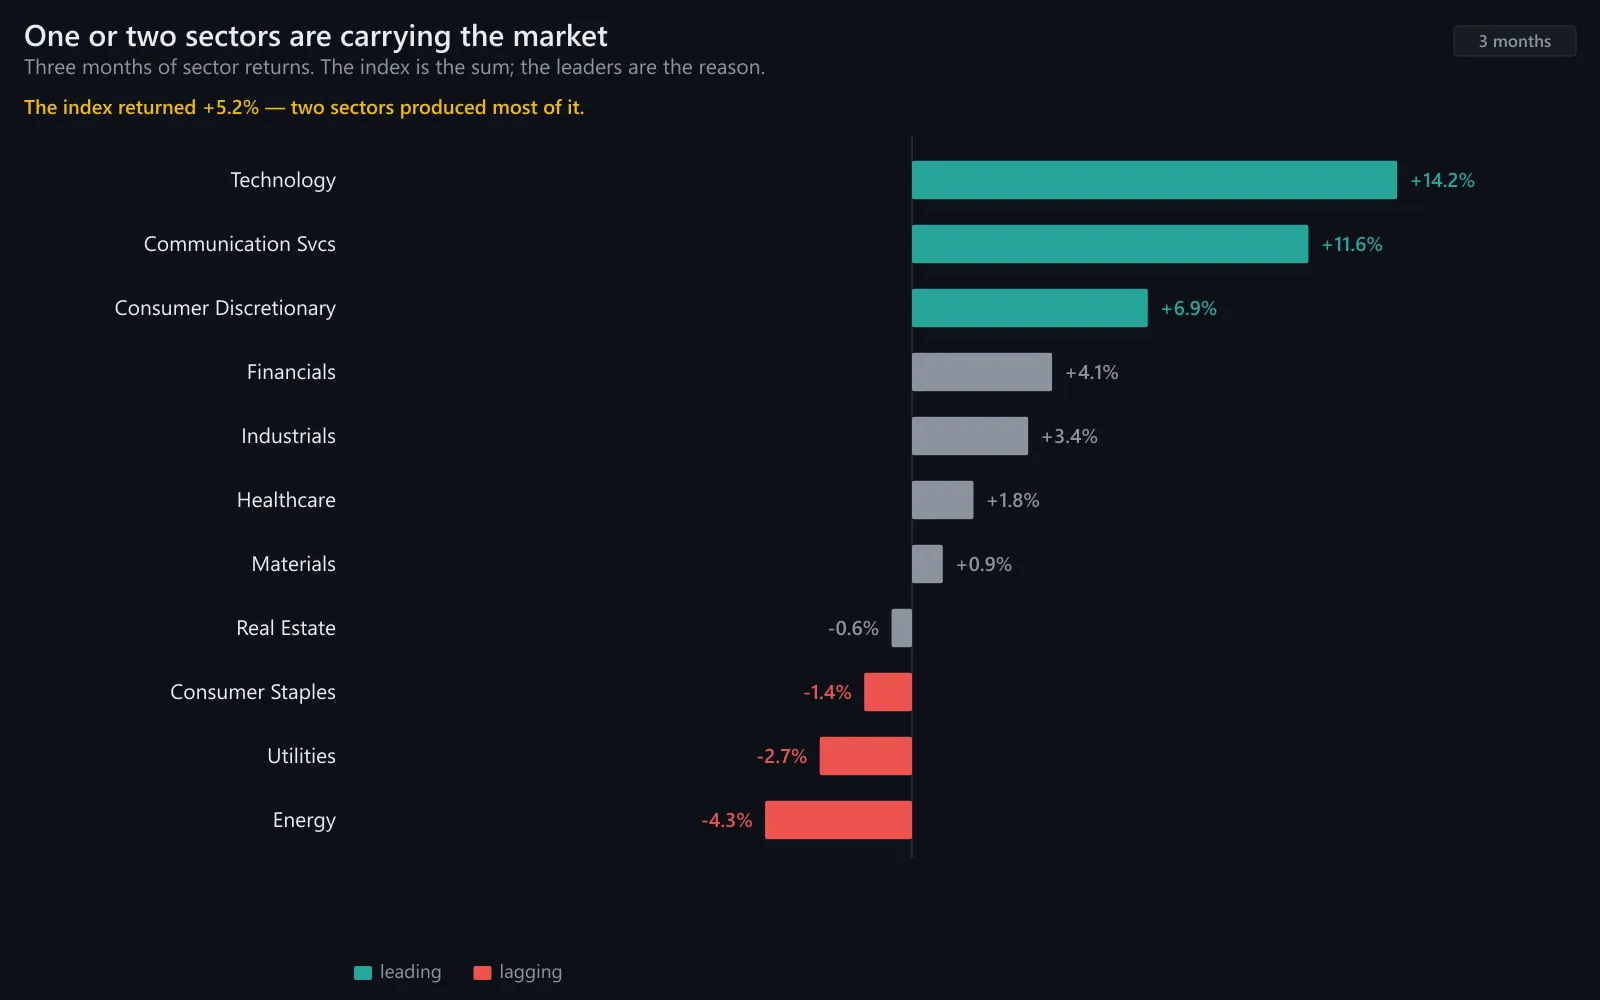
Sector leadership is the answer to 'which sector is doing the work?' At any time one to three of the eleven sectors are outperforming the index and pulling it; the rest are following or dragging. The identity of the leaders is the market's tone in a word: technology means growth, utilities means caution, energy means inflation.
It is read from the sector ranking table and the sector-versus-SPY ratio lines, over one week, one month and three months.
02Why it exists
It exists because capital rotates between sectors as expectations change, and because the index is a sum of sectors weighted by size. Leadership by a heavyweight sector moves the index; leadership by a lightweight can leave the index flat while the market's character changes completely.
03How it is measured or observed
The reading in three glances:
- Ranking tableEleven sectors sorted by return over 1w / 1m / 3m.
- Ratio linesEach sector ÷ SPY; the slope is leadership.
- Cyclical vs defensiveWhich group holds the top three: growth tone or caution tone.
Read · seeing it in the market
04How professionals read it
Professionals read the top three over one month for tone, the one-week column for whether the tone is being confirmed, and the three-month column for whether the leaders are new or established. Then they check the leader's internal breadth — a sector led by two giants is not a broad leader.
They treat leadership as a description of the present, not a forecast. Leaders persist for months and then rotate, and the early rotation looks like noise.
05What strength looks like
Clear leadership: one or two cyclical sectors well ahead of the index, broad inside, with defensives lagging. The index trends and the tone is unambiguous.
Illustrative. The leader (gold) pulls away from SPY (navy); the laggard (grey) falls behind.
Source: illustrative teaching data — not market data
06What weakness looks like
Fragile leadership: one sector carrying the index alone, or defensives quietly on top of the one-week column while the three-month leaders slide. The index may look fine; the table says the tone is changing.
Cyclical leaders → growth tone
- Technology
- Consumer Discretionary
- Communication Services
- Financials, Industrials, Materials (reflation)
Defensive leaders → caution tone
- Utilities
- Consumer Staples
- Healthcare
- Energy on top usually means inflation or supply, not tone
Tone by sector.
Interpret · what it means for you
07What it means for an investor
For an investor sector leadership explains an index fund's behaviour and exposes its concentration. It is for understanding, not timing.
08What it means for a trader
For a trader the leading sectors are where stocks in play are found. The Advanced morning starts with the table.
09What it cannot tell you
- How long the leadership lasts.
- Whether a leading sector is broad inside — check.
- Whether the index will follow a lightweight leader.
Apply · the market right now
10What is happening right now
MAAL TRADING ACADEMY market note
No dated note has been published for this topic yet. We only publish current-market commentary written and dated by the academy — nothing auto-generated.
Data · previous close
Live levels for XLK, XLF, XLE, XLU, XLP appear here once the licensed market-data feed is connected. We do not show unlicensed or made-up numbers.
How to check this yourself today
- Rank the eleven sector ETFs by one-month return.
- Are the top three cyclical or defensive?
- Chart the leader ÷ SPY over three months.
11Visual market example
One sector leads, one lags, the index sits between — the basic picture every morning's table compresses into eleven numbers.
Illustrative.
Source: illustrative teaching data — not market data
Review · practise, keep, connect
12Test your understanding
Read the chart the way you would before a trade. Pick the answer, then read why.
1One-month: Energy +9%, Utilities +5%, Staples +4%, Technology −3%, Discretionary −4%. Tone?
Illustrative.
Source: illustrative teaching data — not market data
13Key takeaways
- The leading sectors are the market's tone in a word.
- Read 1w / 1m / 3m together; check the leader's internal breadth.
- Cyclical leaders = growth; defensive leaders = caution; energy = inflation.
- A description of the present, not a forecast.
15Learn it in class
Advanced Program · Stage 1 · Finding Stocks in Play
The Advanced morning opens with the sector table — before any stock is considered.