
Understand · what it is and why it exists
01What it is
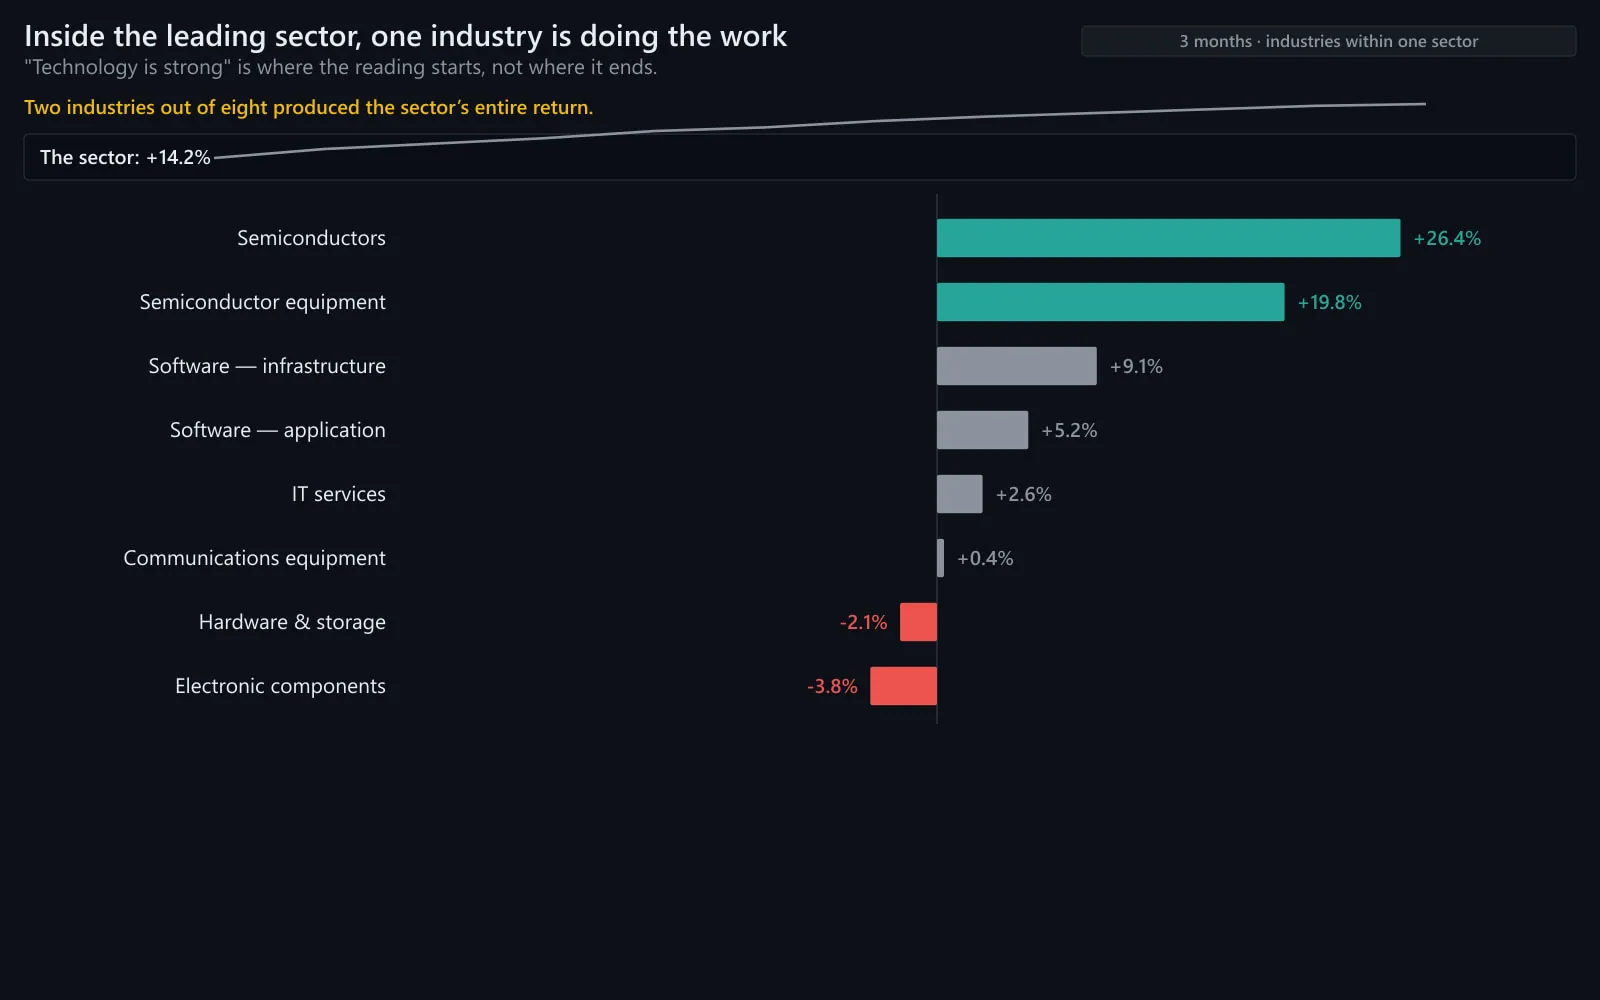
Industry leadership is sector leadership one level down. Each sector contains several industries — technology has semiconductors, software, hardware, IT services; financials has banks, insurers, exchanges, payments; healthcare has pharma, devices, biotech, insurers. They have different drivers and often point different ways.
Reading industries tells you what kind of leadership a sector has. 'Technology leads' can mean chips are ripping on a capital-spending boom or software is rallying on falling rates; the trades are different.
02Why it exists
It exists because sector labels are blunt. A semiconductor manufacturer and a software subscription company share a sector and almost nothing else; when the sector ETF moves, one of them is usually doing it. Industry ETFs and groups exist so the sector can be read honestly.
03How it is measured or observed
One level more precise:
- Industry ETFsSemiconductors (SMH/SOXX), software (IGV), regional banks (KRE), biotech (XBI), homebuilders (XHB), retail (XRT), transports (IYT), oil services (OIH) and others.
- Industry ÷ sector ratioWhich industry is leading its own sector.
- Industry ÷ SPY ratioWhich industries lead the market regardless of sector.
Read · seeing it in the market
04How professionals read it
Professionals read the industry table the way they read the sector table, and they usually find the real leadership there. A sector can be flat while one industry inside it doubles and another halves. Stocks in play cluster in leading industries more tightly than in leading sectors.
They watch certain industries as leading indicators: semiconductors for technology and for risk appetite generally, homebuilders for rates, regional banks for credit stress, transports for the real economy.
05What strength looks like
An industry leading its sector and the market: semiconductors ahead of technology ahead of SPY. The sector's strength is explained, and the stock selection is narrowed to one industry.
Illustrative. Semiconductors (gold) lead software (blue) and SPY (navy) — the sector's leadership has a name.
Source: illustrative teaching data — not market data
06What weakness looks like
A sector average hiding a split: one industry up, another down, the ETF flat. 'Technology is flat' is false for every company in it; the industry view is the only true one.
Industry
- Semiconductors
- Homebuilders
- Regional banks
- Transports
- Biotech
What it reads
- Technology leadership and risk appetite
- Interest-rate expectations
- Credit and deposit stress
- The real economy
- Speculative appetite
Watched beyond their own sector.
Interpret · what it means for you
07What it means for an investor
For an investor industries explain what a sector fund actually holds — and that the largest sector in the index is several different businesses with one label.
08What it means for a trader
For a trader the industry table is the last narrowing step before stocks: leading sectors → leading industries → leading stocks. Most Advanced watchlists come from two or three industries.
09What it cannot tell you
- Industry ETFs can be concentrated too; check holdings.
- Industry leadership rotates faster than sector leadership.
- Not every industry has a clean ETF.
Apply · the market right now
10What is happening right now
MAAL TRADING ACADEMY market note
No dated note has been published for this topic yet. We only publish current-market commentary written and dated by the academy — nothing auto-generated.
Data · previous close
Live levels for SMH, IGV, KRE, XHB appear here once the licensed market-data feed is connected. We do not show unlicensed or made-up numbers.
How to check this yourself today
- For the leading sector, chart its main industry ETFs ÷ the sector ETF.
- Check semiconductors ÷ QQQ, homebuilders ÷ SPY, KRE ÷ XLF.
- Note which industries dominate the new-highs list.
11Visual market example
Two industries in one sector pointing different ways. The sector ETF would average them into nothing; the industry view shows exactly where the leadership is.
Illustrative. Semiconductors (gold) versus software (blue).
Source: illustrative teaching data — not market data
Review · practise, keep, connect
12Test your understanding
Read the chart the way you would before a trade. Pick the answer, then read why.
1XLK +2% on the month. SMH +12%. IGV (software) −6%. Where is the leadership?
Illustrative.
Source: illustrative teaching data — not market data
13Key takeaways
- Sectors are blunt; industries are where leadership actually lives.
- Narrow top-down: sector → industry → stock.
- Certain industries are leading indicators beyond their sector: semis, homebuilders, regional banks, transports.
- A flat sector can hide a boom and a bust.
15Learn it in class
Advanced Program · Stage 1 · Finding Stocks in Play
Most Advanced watchlists come from two or three leading industries — this is the step between the sector table and the stock.