
Understand · what it is and why it exists
01What it is
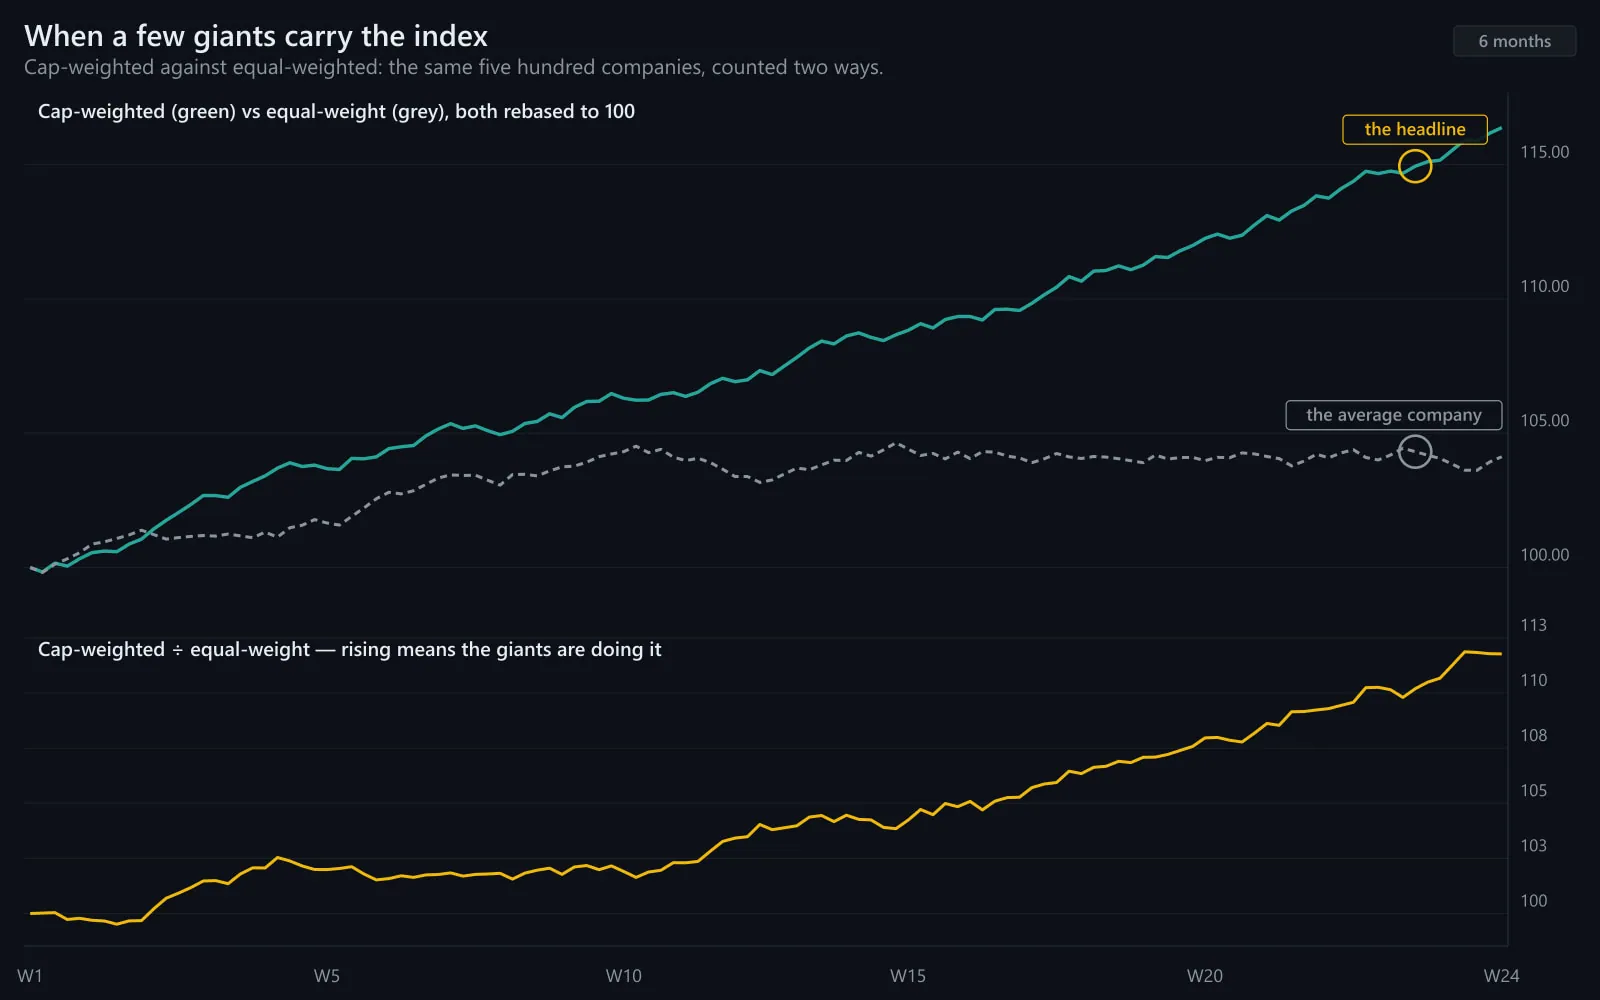
Large-cap leadership is the condition in which the market's biggest companies outperform everything else, pulling cap-weighted indexes higher while the average stock lags. Because the top ten names can be a third of the S&P 500 and close to half of the Nasdaq-100, their leadership can make the index look strong while most of its members are not.
It is the opposite of broad participation, and it is common: long stretches of the last decade were led by a handful of mega-caps.
02Why it exists
It exists because of cap weighting and because of flows. Index funds buy the largest names in proportion to their size, which reinforces their size; investors seeking safety in uncertain markets buy the biggest, most liquid companies; and genuine business dominance concentrates earnings growth in a few firms. All three push the same way.
03How it is measured or observed
How to see it:
- SPY vs RSPCap-weight against equal-weight. SPY leading means the giants are carrying it.
- Top-ten weightThe share of the index in its ten largest holdings; rising means concentration is increasing.
- Mega-cap basket vs indexAn ETF or basket of the largest names against SPY.
- Breadth measuresPercent of stocks above their 200-day average falling while the index rises.
Read · seeing it in the market
04How professionals read it
Professionals read large-cap leadership as a description of fragility, not as a reason to sell. Concentrated markets have continued for years. But they know what they own in such a market — an index fund that is increasingly a bet on a few companies — and they watch equal-weight and breadth for the moment the giants stop carrying.
They also notice when the leadership flips: equal-weight beginning to outperform cap-weight is the first sign of broadening, which is usually read as a healthier structure.
05What strength looks like
Large caps leading with the average stock keeping pace: the giants are strong and so is everyone else. This is the benign version — leadership without concentration.
Illustrative. Mega-caps (gold) lead; SPY (navy) follows; equal-weight (grey) stalls — concentration.
Source: illustrative teaching data — not market data
06What weakness looks like
Large caps leading while the average stock falls: the index at highs, equal-weight down, breadth narrowing. The headline describes five companies. This is the fragile version, and it can last a long time.
Broad
- RSP keeps pace with SPY
- Top-ten weight stable
- Percent above 200-day high
- Small caps participate
Concentrated
- SPY leads RSP
- Top-ten weight rising
- Percent above 200-day falling
- Small caps lag
Same index level, different markets.
Interpret · what it means for you
07What it means for an investor
For an investor a concentrated market means an index fund is quietly becoming a few-stock bet. That is not a reason to sell it; it is a reason to know it, and to understand how equal-weight and total-market funds differ from it.
08What it means for a trader
For a trader a concentrated market means the index's direction is decided by a few names — so traders watch them directly — and that breakouts in the average stock often lack the crowd. Stocks in play are fewer and concentrated in the leaders.
09What it cannot tell you
- It does not predict when the giants stop leading.
- Concentration is not a crash signal; it has persisted for years.
- Large caps can lead for good reasons — real earnings dominance.
Apply · the market right now
10What is happening right now
MAAL TRADING ACADEMY market note
No dated note has been published for this topic yet. We only publish current-market commentary written and dated by the academy — nothing auto-generated.
Data · previous close
Live levels for SPY, RSP, QQQ appear here once the licensed market-data feed is connected. We do not show unlicensed or made-up numbers.
How to check this yourself today
- Chart SPY ÷ RSP over one year.
- Look up SPY's top-ten weight.
- Check the percent of S&P stocks above their 200-day average.
11Visual market example
The picture that defines the condition: the giants pull away, the index follows, the average stock goes nowhere. Anyone reading the index alone is reading five companies.
Illustrative.
Source: illustrative teaching data — not market data
Review · practise, keep, connect
12Test your understanding
Read the chart the way you would before a trade. Pick the answer, then read why.
1SPY +8% on the year. RSP +1%. Top-ten weight up from 28% to 34%. What kind of market is this?
Illustrative.
Source: illustrative teaching data — not market data
13Key takeaways
- A few giants can carry the index while the average stock lags.
- Read SPY against RSP and the top-ten weight.
- Concentration is fragility, not a crash signal.
- Equal-weight beginning to lead is the first sign of broadening.
15Learn it in class
Beginner Program · Stage 3 · How the Stock Market Works
Beginner Day 1 explains cap weighting with exactly this picture — why 'the market is up' can mean five companies are up.