
Understand · what it is and why it exists
01What it is
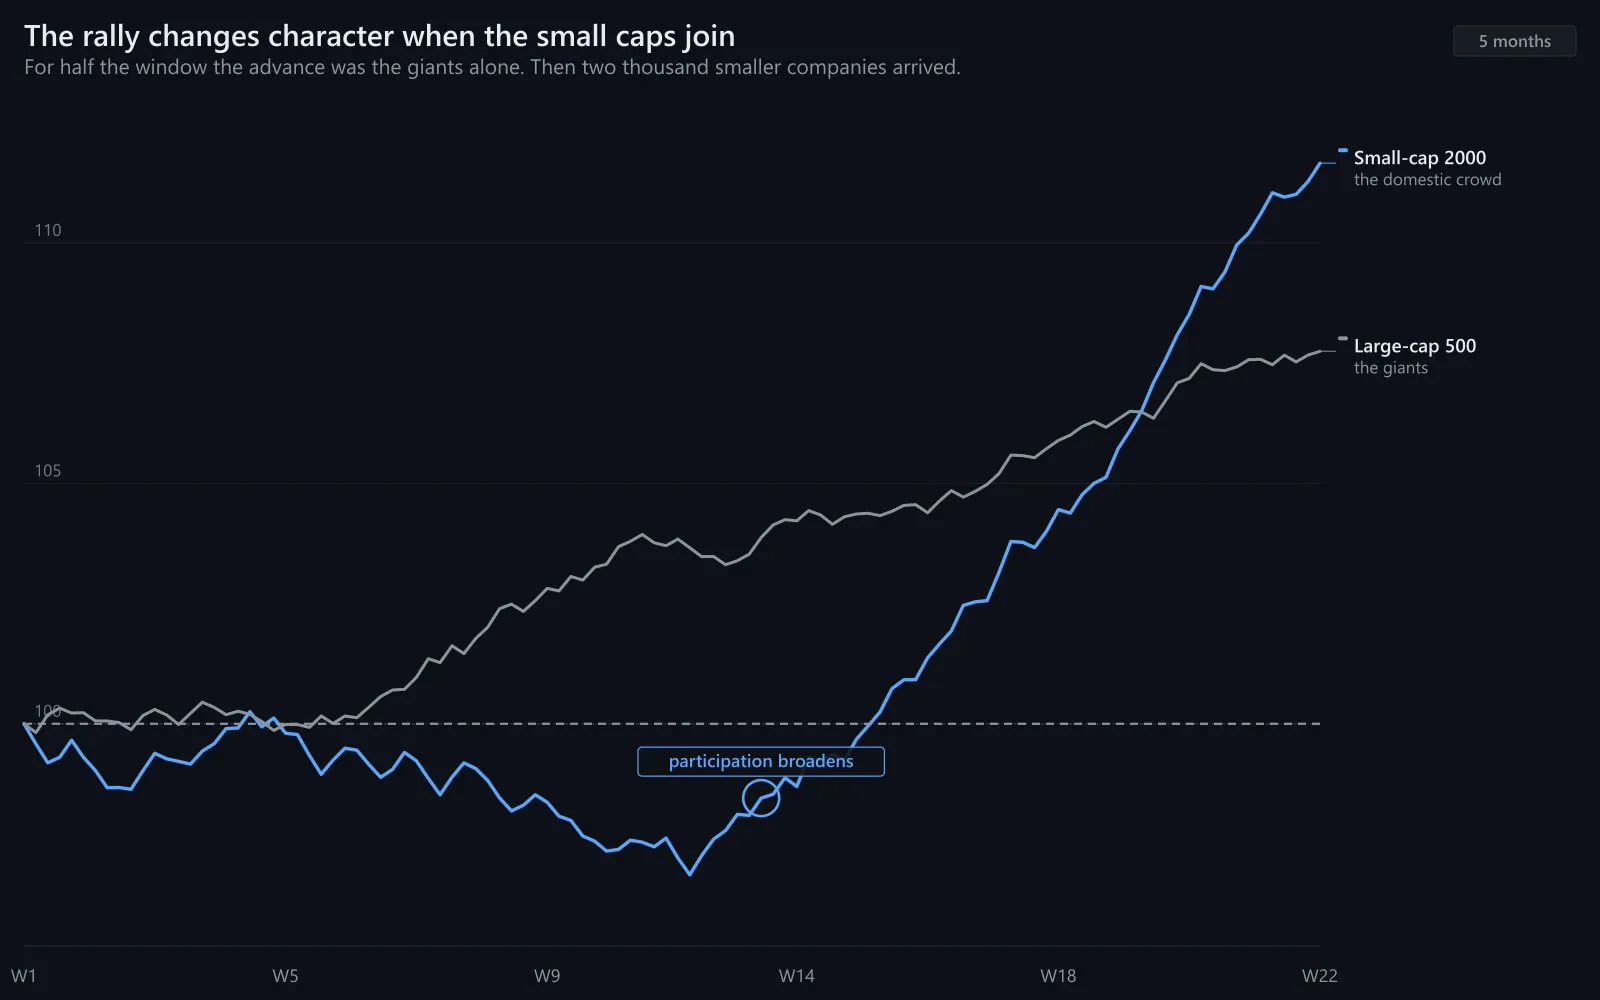
Small-cap participation is whether the Russell 2000 — two thousand smaller, more domestic, more indebted companies — is joining a market advance. When it is, the rally is broad and has the real economy behind it. When it is not, the advance is being carried by large multinationals while the most economically sensitive part of the market is left behind.
It is read from IWM against SPY: the ratio rising means small caps are participating or leading; falling means they are not.
02Why it exists
It exists because small companies are the market's most sensitive corner: more rate exposure, more credit dependence, more domestic revenue, more volatility. They rally when appetite for risk and confidence in the economy are genuine, and they lag when a rally rests on a few safe giants. Their participation is therefore a test of the rally's quality.
03How it is measured or observed
How to see it:
- IWM ÷ SPY ratioRising = participating; falling = sitting out.
- IWM vs its own highsSmall caps making new highs alongside the S&P is confirmation.
- Breadth inside IWMPercent of Russell 2000 members above their 200-day average.
- Regional banksA large weight in IWM; their health is part of small-cap health.
Read · seeing it in the market
04How professionals read it
Professionals read small-cap participation as the confirmation column of a rally. The S&P making highs with IWM along is a broad, risk-on advance; the S&P making highs with IWM well below its own is a narrow one resting on the giants. They also read small caps breaking down while the S&P holds as an early warning about rates and credit.
They size the reading by duration: a week of small-cap lag is noise; a quarter is a structure.
05What strength looks like
Participation: IWM leading or matching SPY into new highs, the ratio rising, regional banks healthy. The crowd, not the giants, is doing the work.
Illustrative. IWM (blue) keeps pace with or leads SPY (navy).
Source: illustrative teaching data — not market data
06What weakness looks like
Non-participation: SPY grinding to highs while IWM rolls over — the ratio falling, small caps below their own highs. The advance is narrow and the rate-sensitive part of the market is under pressure.
Illustrative. After the midpoint IWM (blue) falls behind SPY (navy).
Source: illustrative teaching data — not market data
Interpret · what it means for you
07What it means for an investor
For an investor small-cap participation says whether an S&P 500 fund's gains are shared by the broader economy. An index at highs with small caps lagging for a year is a concentrated market — worth knowing, not necessarily worth acting on.
08What it means for a trader
For a trader IWM joining a move is read as support for breakouts and is part of the Advanced morning tone check. IWM breaking down on a day SPY is flat is the early warning.
09What it cannot tell you
- Small-cap lag is not a crash signal; it has persisted for years.
- IWM is domestic and says little about global growth.
- Reconstitution and other mechanical flows distort short windows.
Apply · the market right now
10What is happening right now
MAAL TRADING ACADEMY market note
No dated note has been published for this topic yet. We only publish current-market commentary written and dated by the academy — nothing auto-generated.
Data · previous close
Live levels for IWM, SPY, KRE appear here once the licensed market-data feed is connected. We do not show unlicensed or made-up numbers.
How to check this yourself today
- Chart IWM ÷ SPY over six months.
- Compare IWM's distance from its 52-week high with SPY's.
- Check KRE alongside IWM.
11Visual market example
Participation, then not: small caps join the first leg and sit out the second. The S&P's chart looks the same in both legs. The rally's character did not.
Illustrative. IWM (blue) participates, then stops.
Source: illustrative teaching data — not market data
Review · practise, keep, connect
12Test your understanding
Read the chart the way you would before a trade. Pick the answer, then read why.
1SPY at a new high. IWM 12% below its own high and falling. KRE weak. Is the rally broad?
Illustrative.
Source: illustrative teaching data — not market data
13Key takeaways
- Small caps joining a rally make it broad; sitting out makes it narrow.
- Read IWM ÷ SPY and IWM's own highs.
- Small caps breaking down while SPY holds is an early warning on rates and credit.
- Duration matters: weeks are noise, quarters are structure.
15Learn it in class
Advanced Program · Stage 1 · Finding Stocks in Play
IWM is on the Advanced morning screen beside SPY and QQQ — its participation is part of how the class weighs the day's breakouts.