
Understand · what it is and why it exists
01What it is
Growth leadership is the condition in which the sectors valued most on future earnings — technology, consumer discretionary, communication services — outperform the market. Investors are paying for the future: confidence is high, rates are tolerable, and risk appetite is strong. It is the market's growth tone.
It is the most common form of leadership of the last decade and the one most dependent on a single variable: the price of the future, set by long-term interest rates.
02Why it exists
It exists because growth companies' values rest on earnings years away, and those values rise fastest when confidence is high and discount rates are low. The tone appears when the market believes in growth and can afford to pay for it.
03How it is measured or observed
How to confirm it:
- XLK, XLY, XLC vs SPYThe three ratio lines rising; QQQ ÷ SPY rising.
- SemiconductorsChips leading technology — the growth engine's own leader.
- Breadth inside growthEqual-weight QQQ keeping pace; several growth industries participating, not two giants.
- RatesGrowth leadership tends to coincide with stable or falling long-term yields; rising yields are its main risk.
Read · seeing it in the market
04How professionals read it
Professionals read growth leadership as the risk-on tone and immediately check its breadth: is it several industries and the average growth stock, or three mega-caps? Broad growth leadership is the healthiest structure a bull market has; giant-only growth leadership is the most fragile.
They watch rates as the tone's main risk and semiconductors as its early warning. Growth leadership that survives a yield rise is strong; growth leadership that fails the moment chips roll over was narrower than it looked.
05What strength looks like
Broad growth leadership: technology, discretionary and communication leading with semiconductors in front, equal-weight growth keeping pace, and rates stable. The market is paying for the future and most growth companies are participating.
Illustrative. Growth sectors (gold) outpace SPY (navy).
Source: illustrative teaching data — not market data
06What weakness looks like
Narrow growth leadership: QQQ at highs, equal-weight growth flat, semiconductors fading, three giants explaining the whole move. Or growth leadership losing its line as yields rise. Both are the tone becoming fragile.
Broad
- Semis leading
- Equal-weight growth keeping pace
- Several growth industries participating
- Survives modest yield rises
Narrow
- Semis lagging
- Equal-weight growth flat
- Three giants explain the move
- Fails on the first yield rise
Check before trusting the tone.
Interpret · what it means for you
07What it means for an investor
For an investor growth leadership has been the dominant story of the last decade and the reason index funds are technology-heavy. Its dependence on rates is the thing to understand: a long rise in yields has historically been the environment in which growth leadership ended.
08What it means for a trader
For a trader growth leadership is the environment in which breakouts in technology names tend to have the crowd behind them. The Advanced watchlist leans into growth industries when the tone is confirmed — and checks semiconductors and rates every morning for the first sign it is not.
09What it cannot tell you
- How long it lasts; growth has led for years and reversed in quarters.
- Whether it is broad — check equal-weight and semis.
- What rates will do; the tone depends on them.
Apply · the market right now
10What is happening right now
MAAL TRADING ACADEMY market note
No dated note has been published for this topic yet. We only publish current-market commentary written and dated by the academy — nothing auto-generated.
Data · previous close
Live levels for QQQ, XLK, SMH, SPY appear here once the licensed market-data feed is connected. We do not show unlicensed or made-up numbers.
How to check this yourself today
- Chart QQQ ÷ SPY and XLK ÷ SPY over three months.
- Compare SMH with XLK and QQQE with QQQ.
- Note the 10-year yield's direction over the same period.
11Visual market example
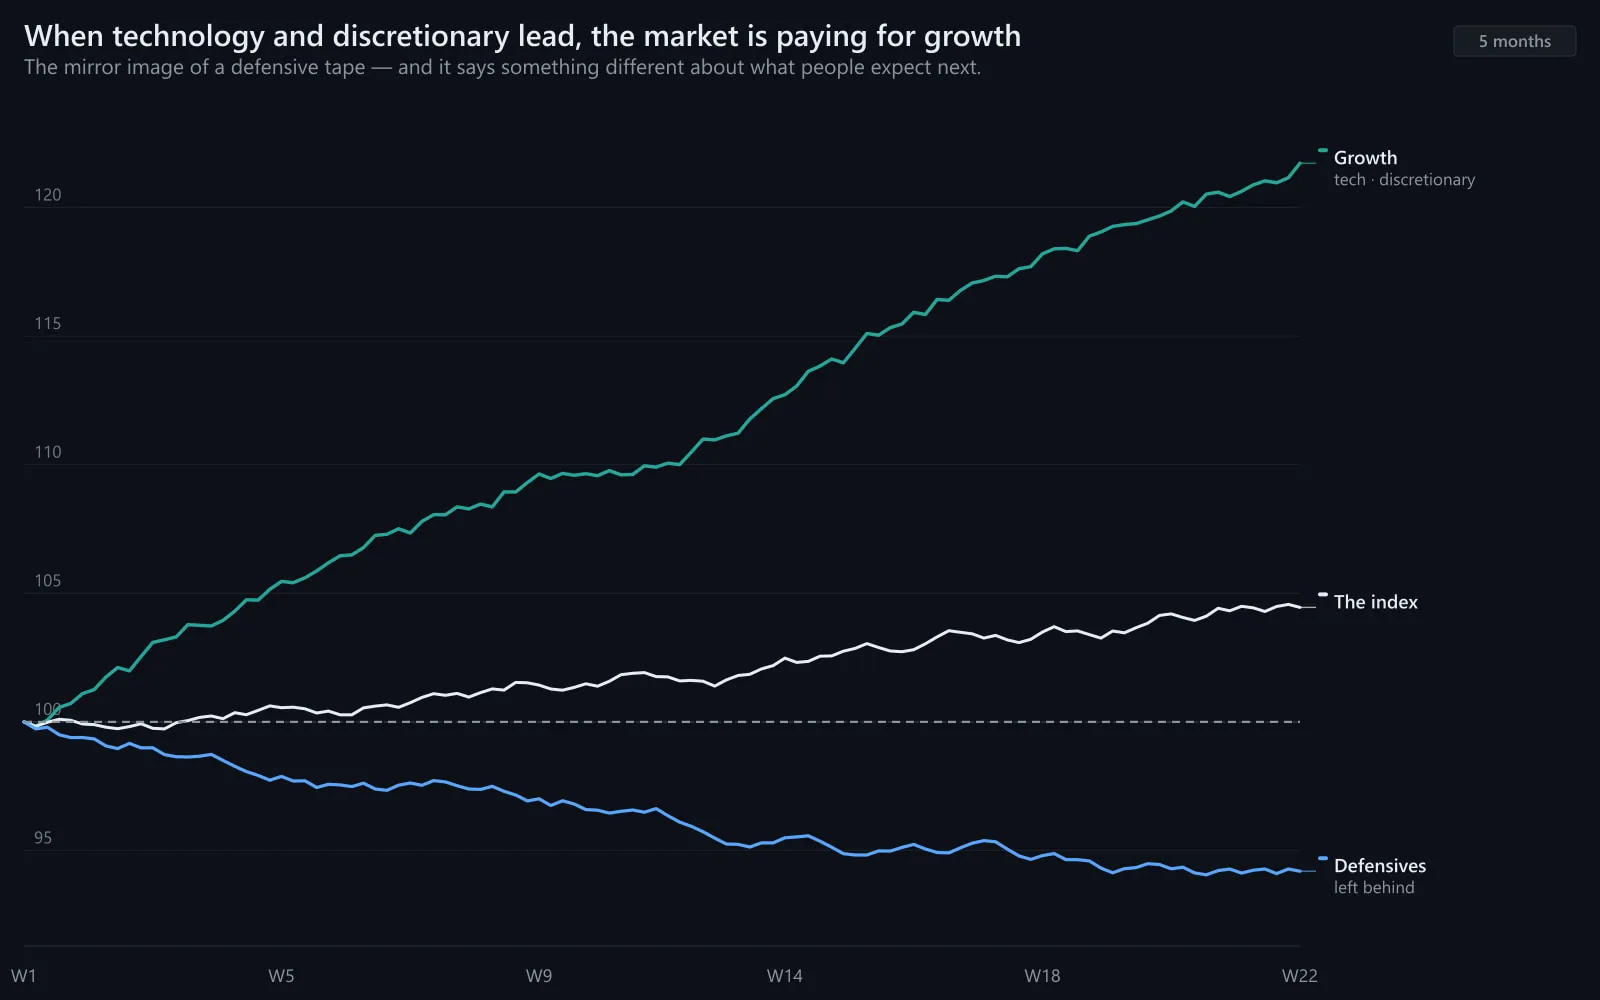
Growth leading on one page. Whether it is the healthiest structure in the market or the most fragile is decided by two checks this chart cannot show: breadth inside growth, and the direction of rates.
Illustrative.
Source: illustrative teaching data — not market data
Review · practise, keep, connect
12Test your understanding
Read the chart the way you would before a trade. Pick the answer, then read why.
1QQQ +10% on the quarter at a new high. QQQE (equal-weight) +1%. SMH −3%. The 10-year yield is rising. How healthy is growth leadership?
Illustrative.
Source: illustrative teaching data — not market data
13Key takeaways
- Technology, discretionary and communication leading is the growth / risk-on tone.
- Check breadth inside growth: semis and equal-weight decide whether it is broad or giant-only.
- Rates are the tone's main risk; semiconductors are its early warning.
- Broad growth leadership is the healthiest bull structure; narrow growth leadership is the most fragile.
15Learn it in class
Advanced Program · Stage 1 · Finding Stocks in Play
When growth leadership is confirmed, the Advanced watchlist leans into technology industries — and checks semiconductors and yields every morning for the first crack.