
Understand · what it is and why it exists
01What it is
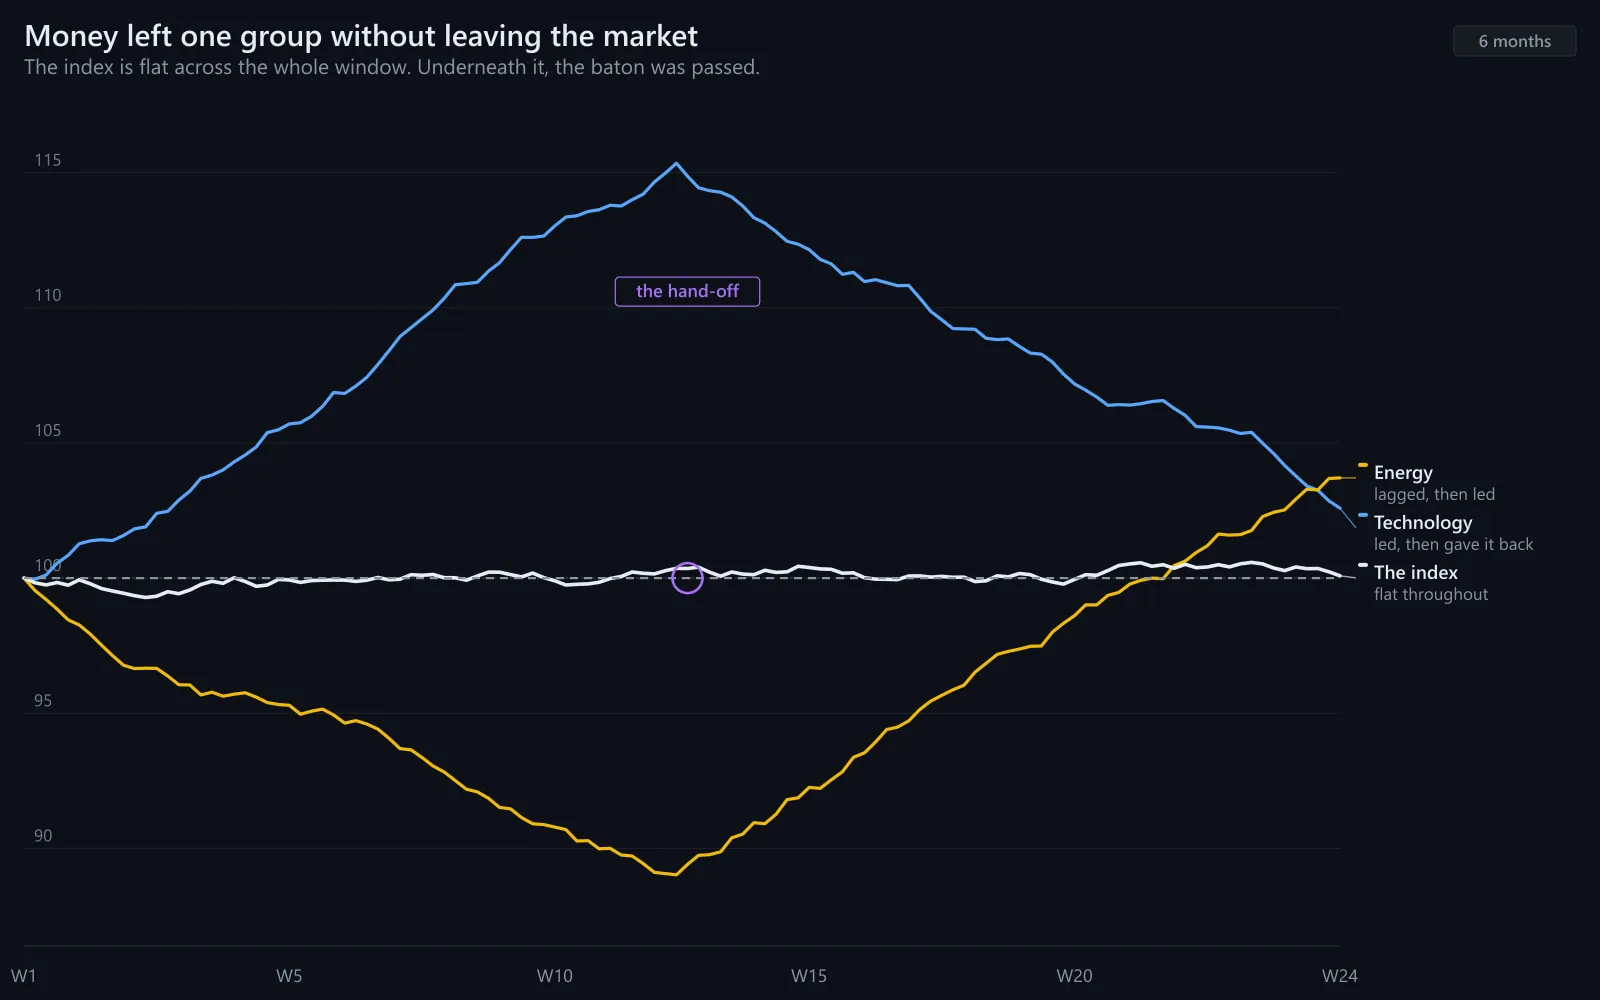
Leadership rotation is the transfer of outperformance from one sector, industry or style to another. Technology pauses and industrials take over; growth rests and value leads; large caps stall and small caps catch up. The index may barely move; the leaders change.
Rotation is the market's normal way of continuing an advance. It becomes a warning only when it crosses the cyclical/defensive line — money moving from growth into safety rather than from growth into other growth.
02Why it exists
It exists because leaders get expensive and crowded, laggards get cheap and ignored, and capital moves from the first to the second. It also reflects changing expectations: rates, growth, inflation. The ranking table rearranges itself as the story changes.
03How it is measured or observed
How to see it:
- Rank changesWhich sectors moved up or down the one-week and one-month tables.
- Ratio slope changesA sector ÷ SPY line turning from falling to rising is rotation beginning.
- Cyclical/defensive crossingDid the rotation stay within cyclicals, or cross into defensives?
- Index behaviour during rotationFlat while leaders change = healthy handoff; falling while defensives lead = tone change.
Read · seeing it in the market
04How professionals read it
Professionals read rotation within cyclicals as a healthy handoff — the advance continuing with a new leader — and rotation into defensives as a tone change. The first prompts a search for the new leader; the second, a fresh look at risk in the old leaders.
They confirm rotation over weeks. The first days look like noise; the third week looks like a trend. They also distinguish rotation (money moving within the market) from de-risking (money leaving it): in true rotation, something is going up.
05What strength looks like
Healthy rotation: the old leader fades, a new cyclical leader rises, the index holds or grinds higher. The baton passes without the race stopping.
Illustrative. Old leader (gold) fades; new leader (grey) rises; SPY (navy) holds.
Source: illustrative teaching data — not market data
06What weakness looks like
Tone-change rotation: the old leaders fall, defensives rise, and the index slips — money moving to safety rather than to a new cyclical leader. Same mechanics, different meaning.
Healthy handoff
- Growth → industrials, financials, materials
- Large → small caps
- Index holds or rises
- Breadth stable or improving
Tone change
- Growth → utilities, staples, healthcare
- Small caps → large caps
- Index flat or falling
- Breadth narrowing, VIX rising
Which side of the line the money crossed.
Interpret · what it means for you
07What it means for an investor
For an investor rotation is why much of a leader's move may be done by the time it is obvious — one reason many investors hold several groups.
08What it means for a trader
For a trader rotation often means rethinking the size given to yesterday's leaders and studying early names in the new leader. The Advanced morning table is read for exactly these changes.
09What it cannot tell you
- How long the new leadership lasts.
- Whether the first week is rotation or noise; confirm over weeks.
- Whether a defensive rotation leads to a decline; it describes tone, not outcome.
Apply · the market right now
10What is happening right now
MAAL TRADING ACADEMY market note
No dated note has been published for this topic yet. We only publish current-market commentary written and dated by the academy — nothing auto-generated.
Data · previous close
Live levels for XLK, XLI, XLF, XLU, XLP appear here once the licensed market-data feed is connected. We do not show unlicensed or made-up numbers.
How to check this yourself today
- Compare this week's sector ranking with the three-month ranking. What moved?
- Did any movement cross the cyclical/defensive line?
- Is something rising, or is everything falling at different speeds?
11Visual market example
Rotation on one page: one line fades, another rises, the index sits still. Whether that was healthy or a warning depends entirely on which sector each line was.
Illustrative. The identity of the new leader decides the reading.
Source: illustrative teaching data — not market data
Review · practise, keep, connect
12Test your understanding
Read the chart the way you would before a trade. Pick the answer, then read why.
1Over three weeks technology's ratio to SPY has fallen and industrials' has risen. The index is up 1%. Breadth is stable. Healthy or a warning?
Illustrative.
Source: illustrative teaching data — not market data
13Key takeaways
- Rotation is money moving within the market; it is the normal way advances continue.
- Within cyclicals = healthy handoff; into defensives = tone change.
- Confirm over weeks; the first days look like noise.
- Traders look for the new leader early and rethink the size given to the old one.
15Learn it in class
Advanced Program · Stage 1 · Finding Stocks in Play
The Advanced table is read for rank changes every morning — rotation shapes where the class looks and how much size it gives yesterday's leaders.