
Understand · what it is and why it exists
01What it is
Implied volatility is the level of future price movement that option prices imply. Options are insurance; their price rises when the market expects bigger moves and falls when it expects calm. Back the expected movement out of the price and you have implied volatility — a forecast, expressed as an annualized percentage like historical volatility.
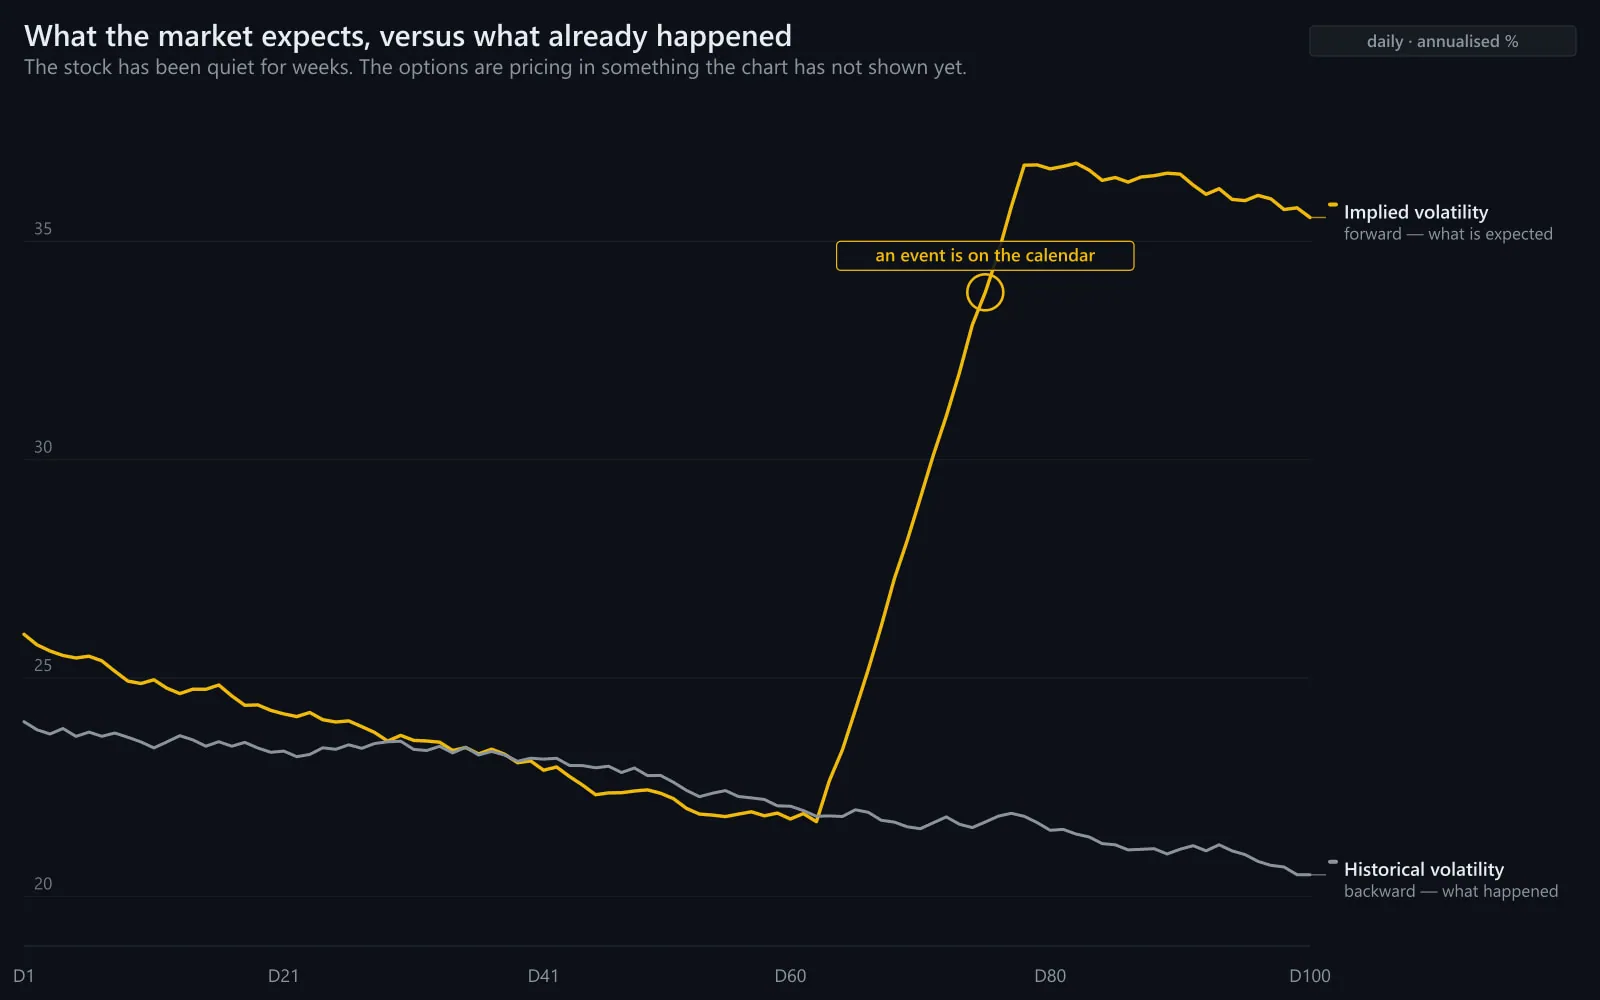
Unlike historical volatility, it can see the future — or at least the calendar. A stock with earnings in three days has high implied volatility even if it has been dead quiet, because the options market knows a big move is scheduled.
02Why it exists
It exists because options must be priced, and pricing them requires a view on how much the underlying will move. That view, aggregated across every participant buying and selling options, becomes a public number — the market's consensus forecast of volatility, updated continuously.
03How it is measured or observed
Where to find it and how to read it:
- Option chainsEvery listed option shows its implied volatility. Near-term, at-the-money options give the cleanest read on the next few weeks.
- IV rank / IV percentileWhere today's implied volatility sits against its own past year. 90th percentile = options are expensive relative to history; 10th = cheap.
- Expected moveThe move the options market is pricing for a period, usually shown for earnings. A ±7% expected move means options are priced for roughly that size of reaction.
- IV versus HVImplied above realized means the market expects more movement than it is getting — braced. Implied below realized means it has been caught off guard.
Read · seeing it in the market
04How professionals read it
Professionals read implied volatility as the price of insurance and as a sentiment gauge. High IV means participants are paying up for protection or for a bet on movement; low IV means complacency or genuine calm. Neither is a signal, but a sharp change in either direction usually accompanies a regime change.
They compare it with realized volatility constantly. When IV sits far above HV for weeks, the market is braced for something; when HV suddenly exceeds IV, the market was surprised. The gap is information about expectations meeting reality.
And they use expected moves as a reality check around events: if the options market prices a ±7% earnings move, a stock trade through earnings is a bet on a coin with a 7% swing, whatever the chart pattern says.
05What strength looks like
Implied volatility doing its job looks like IV rising steadily into a known event and collapsing the moment it passes — the 'volatility crush' — while realized movement lands roughly where the expected move said it would.
Historical (realized)
- Computed from past daily moves
- Tells you what happened
- Annualized standard deviation of returns
- Lags regime changes
Implied
- Backed out of option prices
- Tells you what the market expects
- Rises before known events
- Often wrong — that is why options trade
Backward and forward measures of the same thing.
06What weakness looks like
Implied volatility failing looks like a market priced for calm that gets a shock: IV low, then a gap far beyond anything options had priced. Realized explodes past implied, options reprice violently, and anyone short volatility discovers what the insurance was for.
Illustrative. Price (navy) breaks far beyond what a calm IV had priced; implied (gold, indexed) spikes after the fact.
Source: illustrative teaching data — not market data
Interpret · what it means for you
07What it means for an investor
For an investor implied volatility is mostly a temperature reading: a high VIX means the crowd is paying for protection, which usually means a lot of selling has already happened. It is context for understanding the mood — not a timing tool and not a forecast of returns.
08What it means for a trader
For a trader it sets the price of any options strategy and frames any trade through an event. The Advanced program's rule applies: a known event with a large expected move is a catalyst, not a setup. The class studies the reaction after, not the coin flip before.
09What it cannot tell you
- It is a forecast made by people and is frequently wrong in both directions.
- High IV does not mean the move will be down; it means the move is expected to be large.
- IV can stay high or low for long periods; extremes are not timers.
Apply · the market right now
10What is happening right now
MAAL TRADING ACADEMY market note
No dated note has been published for this topic yet. We only publish current-market commentary written and dated by the academy — nothing auto-generated.
Data · previous close
Live levels for SPY, QQQ appear here once the licensed market-data feed is connected. We do not show unlicensed or made-up numbers.
How to check this yourself today
- Look up the VIX and its one-year percentile.
- For a stock you follow, find the at-the-money implied volatility and compare it with its 30-day historical volatility.
- Check the expected move priced for its next earnings.
11Visual market example
Implied versus realized over a calm stretch, then a shock: the market priced calm, got a jump, and repriced insurance after the fact. The gap before the shock was the complacency; the gap after was the fear. Both are readable in one line.
Illustrative. Implied volatility (gold) drifts low, then spikes as the index (navy) breaks.
Source: illustrative teaching data — not market data
Review · practise, keep, connect
12Test your understanding
Read the chart the way you would before a trade. Pick the answer, then read why.
1A stock reports earnings tomorrow. Options price a ±8% move. The chart shows a tidy bull flag. Is the flag a setup?
Illustrative.
Source: illustrative teaching data — not market data
13Key takeaways
- Implied volatility is the market's forward forecast of movement, built into option prices.
- It rises into known events and collapses after them.
- Compare it with realized volatility: the gap is expectations meeting reality.
- It is a forecast, not a fact — and not a direction.
15Learn it in class
Advanced Program · Stage 1 · Finding Stocks in Play
Advanced Day 1 sorts catalysts into tradeable and binary — the expected move is the number that decides which side of the line an event falls on.