
Understand · what it is and why it exists
01What it is
The VIX is an index computed from the prices of S&P 500 options. It represents the annualized volatility the options market expects over the next thirty days. A reading of 16 means options are priced for the S&P to move at a pace consistent with about 16% a year — roughly 1% a day. A reading of 40 means two and a half times that.
It is called the fear gauge because it rises when participants pay up for protection, which they do when they are afraid. It is not a measure of whether the market will fall; it is a measure of how much movement is being priced.
02Why it exists
It exists to give the market a single, continuously updated number for expected volatility on its benchmark index — useful for pricing, for hedging, and for reading sentiment. Its spikes line up with every major stress event of the last three decades, which is why it is watched far beyond the options market.
03How it is measured or observed
Reading the level and its behaviour:
- Rough rangesBelow 15: calm, sometimes complacent. 15–25: normal. 25–35: stressed. Above 40: crisis conditions. These are conventions, not rules.
- Direction and speedA VIX rising from 14 to 22 in three days is more informative than a VIX sitting at 22 for a month. Speed of change is the fear arriving.
- VIX vs realizedWhen the VIX runs well above the S&P's realized volatility, the market is braced; when realized exceeds the VIX, it has been surprised.
- Term structureNear-term versus longer-dated VIX futures. Near-term above longer-term (inverted) happens in acute stress and tends not to last.
- VXNThe Nasdaq-100 equivalent. Runs structurally higher than the VIX because QQQ is more volatile.
Read · seeing it in the market
04How professionals read it
Professionals read the VIX for regime and for change. A VIX in the teens with the S&P trending is a calm regime in which pullbacks are shallow; a VIX above 30 is a regime in which daily moves of 2–3% are normal and stops placed for the calm regime are hit by noise.
They watch spikes for exhaustion. A VIX that spikes sharply and then stops rising while the index makes a new low is often a sign that selling is exhausting — not a buy signal, but the environment in which panics end. A VIX that grinds higher for weeks is a different, slower kind of stress.
They do not treat a low VIX as a sell signal or a high VIX as a buy signal. Both levels have persisted for long stretches in both directions.
05What strength looks like
A calm regime: the VIX in the teens, drifting; the S&P grinding higher with shallow pullbacks. The number that matters here is the first sharp rise — that is the regime changing, and it usually changes faster than people expect.
Illustrative. VIX (gold) low and stable; SPY (navy) trending.
Source: illustrative teaching data — not market data
06What weakness looks like
A stress regime: the VIX spiking as the index breaks, then either exhausting (the spike stops while the index keeps falling) or grinding (a slow rise that persists). The first tends to mark panics; the second tends to mark bear markets.
Illustrative. The speed of the rise is the information.
Source: illustrative teaching data — not market data
Interpret · what it means for you
07What it means for an investor
For an investor the VIX is a reminder that the regime has changed when it spikes — and a reason to have a plan made in advance rather than in the spike. No VIX level says what a long-term holder should do.
08What it means for a trader
For a trader the VIX sets the day's sizing and strategy. In a calm regime (VIX in the teens) stops can sit closer and trends tend to be smoother. In a stressed regime (VIX in the 30s) stops widen, size comes down, and reversals are more common. Reading it in the morning is part of the Advanced tone check.
09What it cannot tell you
- It does not predict direction. A rising VIX can accompany a rally.
- It does not predict timing; extremes persist.
- It measures the S&P 500 only; single stocks have their own implied volatility.
- Its 'fear gauge' name overstates it: it is the price of movement, not of fear alone.
Apply · the market right now
10What is happening right now
MAAL TRADING ACADEMY market note
No dated note has been published for this topic yet. We only publish current-market commentary written and dated by the academy — nothing auto-generated.
Data · previous close
Live levels for SPY appear here once the licensed market-data feed is connected. We do not show unlicensed or made-up numbers.
How to check this yourself today
- Look up the VIX, its level a week ago, and its one-year range.
- Compare it with the S&P's realized 20-day volatility.
- Check the VIX term structure if your platform shows it.
11Visual market example
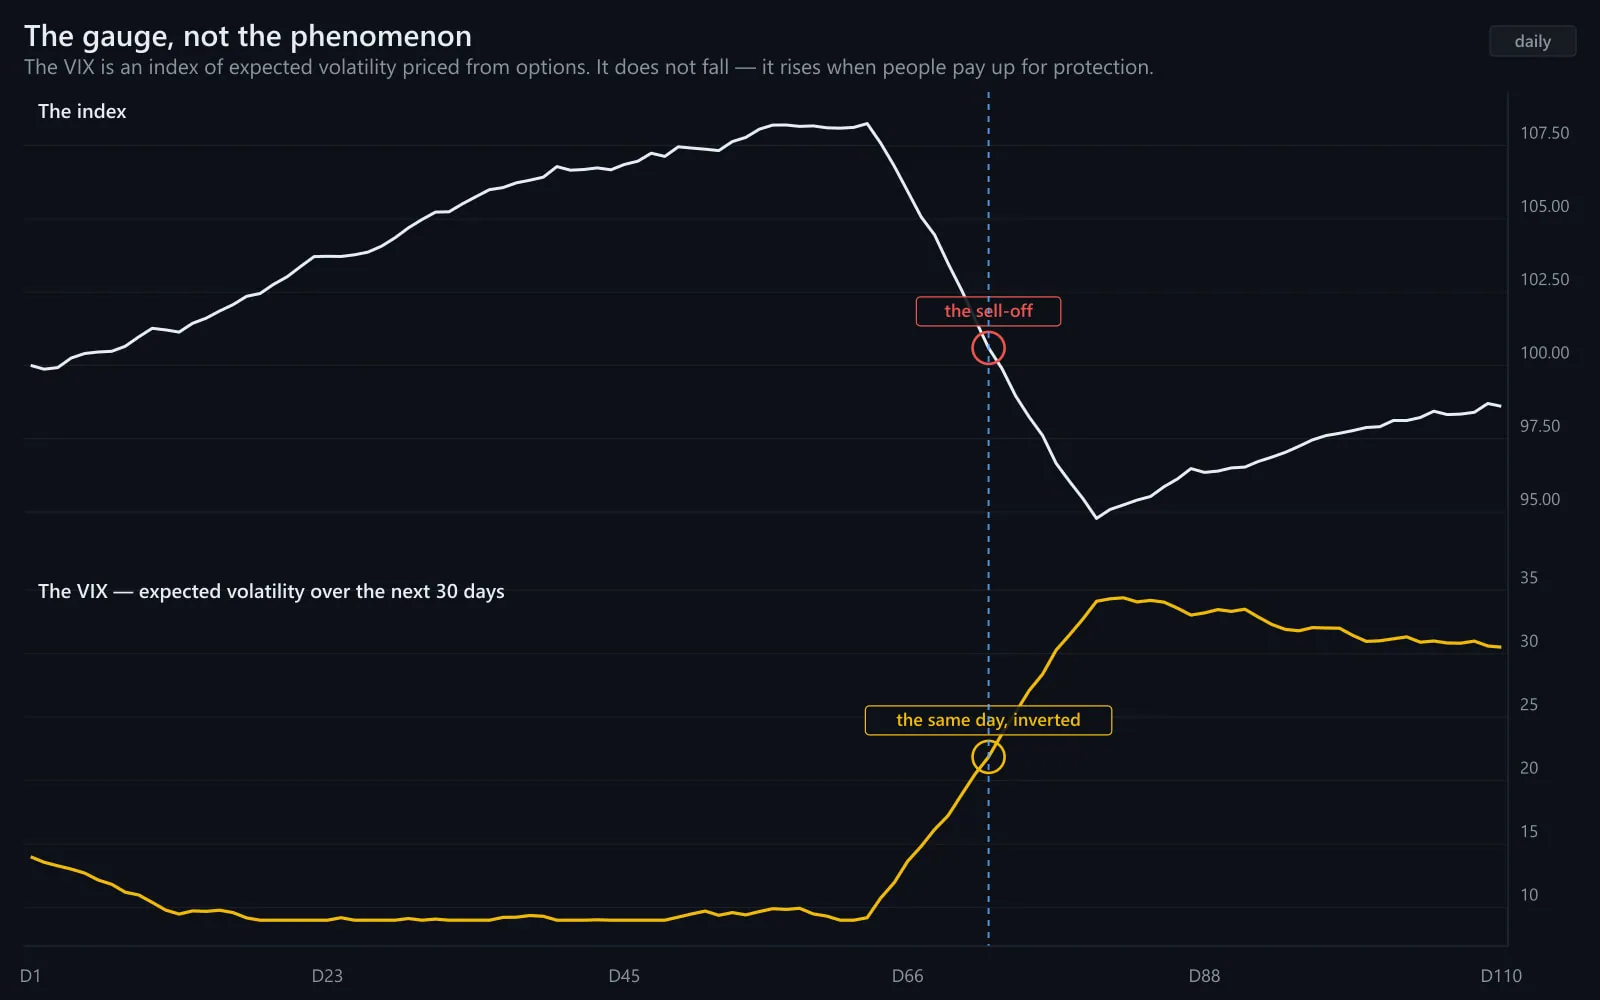
A calm stretch, then a shock: the VIX in the teens for weeks, then a spike as the index breaks. Nothing in the calm stretch predicted the timing. Everything in the spike described the new regime — and resizing on day one of the spike is the response the class practises.
Illustrative. Read the VIX for the regime, not the forecast.
Source: illustrative teaching data — not market data
Review · practise, keep, connect
12Test your understanding
Read the chart the way you would before a trade. Pick the answer, then read why.
1The VIX has gone from 13 to 31 in four sessions. What typically changes in a trader's plan today?
Illustrative.
Source: illustrative teaching data — not market data
13Key takeaways
- The VIX is the expected 30-day volatility of the S&P 500, priced by options.
- Read it for regime and for speed of change, not for direction.
- Teens = calm; 30s = stress; spikes that stop rising often mark exhaustion.
- It changes sizing and strategy — that is its practical use.
15Learn it in class
Advanced Program · Stage 1 · Finding Stocks in Play
The VIX is on the Advanced morning screen beside the sector table — it informs the day's size and which setups the class studies.