
Understand · what it is and why it exists
01What it is
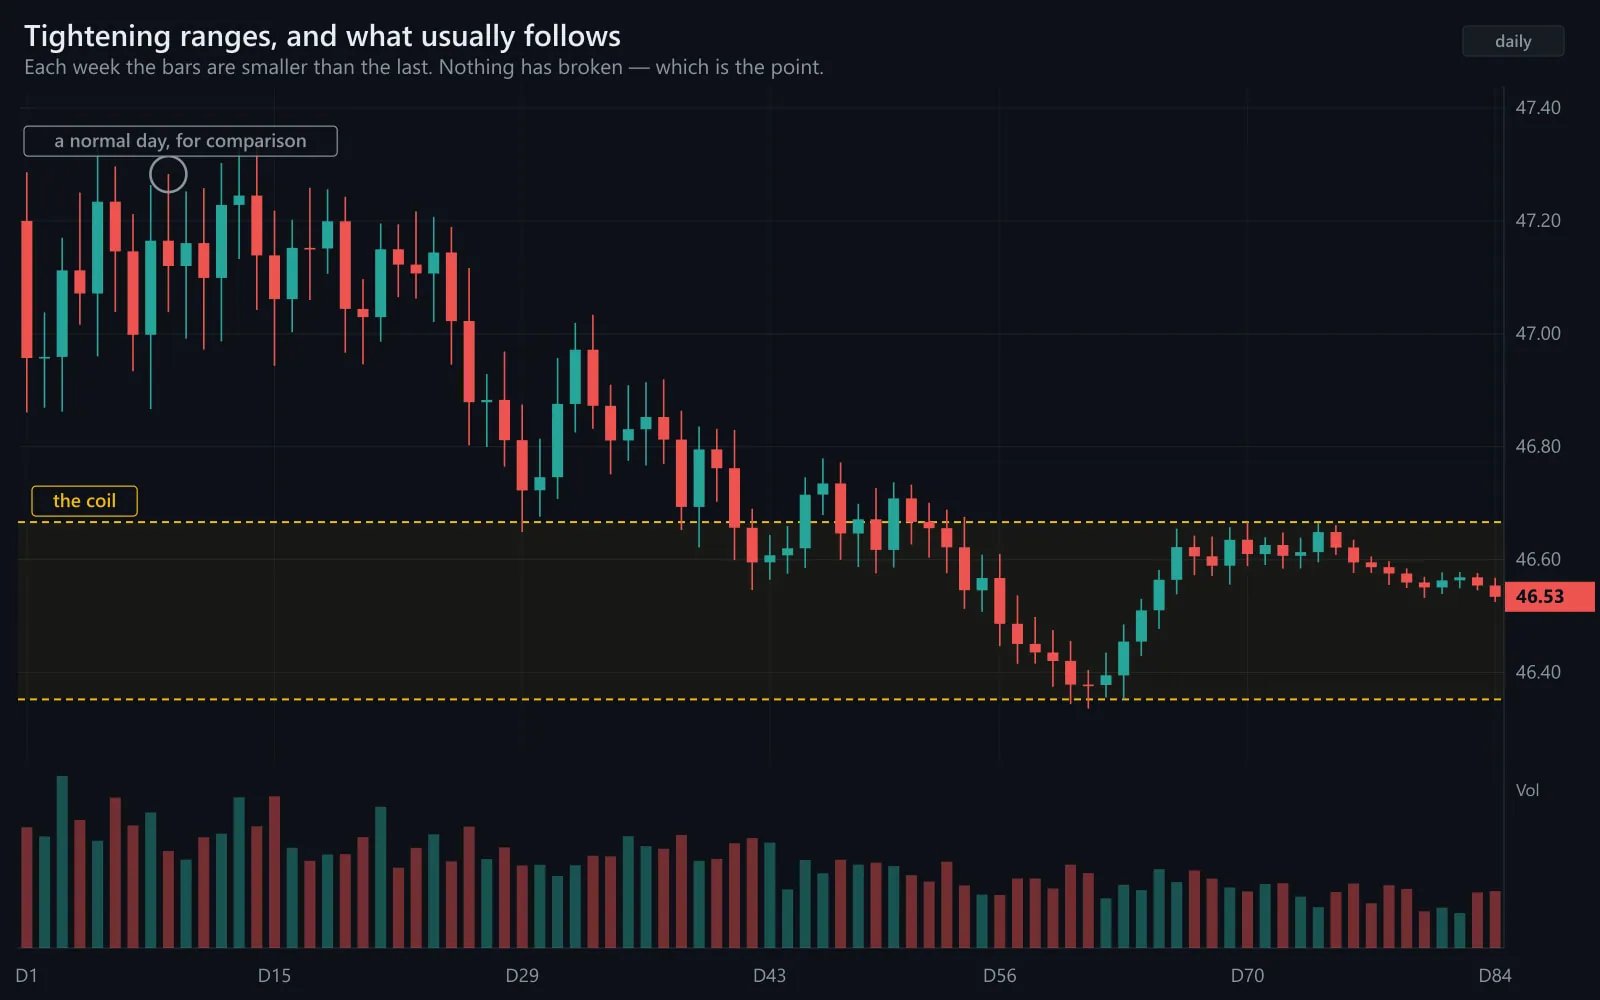
Volatility contraction is the opposite of expansion: daily ranges shrinking week over week, ATR falling, bands narrowing, volume often drying up. Price drifts sideways in a tightening band while participants wait.
It is the market's quiet before a decision. Contraction does not say what the decision will be; it says one is coming, and that when it comes, it tends to be larger than the recent past suggests.
02Why it exists
It exists because disagreement resolves. After a large move, buyers and sellers converge on a price; positions accumulate; the range narrows as fewer participants are willing to trade far from the consensus. The longer the consensus holds, the more positions and stops cluster around it — and the more energy is stored for the eventual break.
03How it is measured or observed
Contraction shows up in every volatility measure at once:
- Falling ATRThe 14-day ATR declining for two or more weeks.
- Band widthBollinger Band width at a multi-week low — the 'squeeze'.
- Narrowing rangeLower highs and higher lows on the daily chart; a visible wedge or flag.
- Drying volumeVolume declining into the apex — participants waiting.
- Low implied volatilityOptions cheap relative to the stock's history; the market priced for calm.
Read · seeing it in the market
04How professionals read it
Professionals read contraction as preparation time. They mark the range's edges, compute what size will be appropriate on the break (smaller than the quiet period would suggest, because the break will be large), and wait. What they study is the break, not the middle of the range.
They distinguish contraction in a trend from contraction at a top or bottom. A tight flag after a strong move often resolves in the direction of the move; a tight range after a long decline is ambiguous. Context decides the odds; the contraction itself only suggests magnitude.
And they respect how long it can last. Contraction persists far longer than feels reasonable, and the impatient trader who buys the 'breakout' inside the range is usually the liquidity for the real one.
05What strength looks like
A constructive contraction: a tight flag after a strong advance, volume declining into it, each pullback shallower than the last. Continuation is the more common reading, and the break — when it comes — starts the next expansion.
Illustrative. Ranges shrink; energy is stored.
Source: illustrative teaching data — not market data
06What weakness looks like
A deceptive contraction: a narrowing range that resolves with a false break in one direction, traps the early entrants, and then breaks the other way. The contraction suggested a large move; it said nothing about direction or how many head-fakes came first.
What it tells you
- A large move is becoming likely
- Where stops are clustering (outside the range)
- What size will be appropriate after the break
- Where the edges are
What it cannot
- Direction
- Timing
- Whether the first break is real
- How far the move goes
What the quiet period can and cannot tell you.
Interpret · what it means for you
07What it means for an investor
For an investor contraction is mostly invisible and mostly irrelevant — except as a warning that a calm stretch in the index is not the same as a safe one. The quietest markets have preceded some of the largest moves.
08What it means for a trader
For a trader contraction is the setup's incubation. The Advanced program's range framework — Range high → Range low → Entry → Stop → Target — is built for exactly this: marking the edges, planning the break, sizing for expansion, and staying out of the middle.
09What it cannot tell you
- Direction.
- Timing — contraction can persist for weeks beyond any reasonable expectation.
- Whether the first break is real; false breaks from tight ranges are common.
Apply · the market right now
10What is happening right now
MAAL TRADING ACADEMY market note
No dated note has been published for this topic yet. We only publish current-market commentary written and dated by the academy — nothing auto-generated.
Data · previous close
Live levels for SPY, QQQ appear here once the licensed market-data feed is connected. We do not show unlicensed or made-up numbers.
How to check this yourself today
- Find a stock or index whose 14-day ATR has fallen for two weeks.
- Mark its range high and low.
- Check its implied volatility percentile — is the market priced for calm?
- Compute the size a fixed dollar risk allows on a break, assuming the range doubles.
11Visual market example
Contraction, then expansion, on one page. Everything about the quiet period was patience: mark the edges, plan, wait. Everything about the release was speed: direction in one bar, size recomputed at once. The two halves require opposite temperaments from the same trader.
Illustrative. The contraction (grey) is for planning; the expansion (navy) is the move.
Source: illustrative teaching data — not market data
Review · practise, keep, connect
12Test your understanding
Read the chart the way you would before a trade. Pick the answer, then read why.
1A stock has been in a tightening range for four weeks. It ticks just above the range high on low volume and comes back inside by the close. What happened?
Illustrative.
Source: illustrative teaching data — not market data
13Key takeaways
- Contraction stores energy: shrinking ranges, falling ATR, drying volume.
- It suggests a large move, not a direction or a date.
- The class marks the edges, plans the break, sizes for expansion, and stays out of the middle.
- First breaks from tight ranges are often false; volume decides.
15Learn it in class
Advanced Program · Stage 4 · Trading Ranges
Advanced Day 1: ranges — high, low, entry, stop, target — and the discipline of waiting for the edge instead of trading the middle.