
Understand · what it is and why it exists
01What it is
Earnings reports are scheduled shocks. Four times a year a company publishes results and guidance, and its stock can move more in one session than in the previous month. The options market knows the date, so implied volatility rises into it — sometimes doubling — and collapses the morning after, whatever the result.
The 'expected move' is the size of reaction options are pricing: a ±6% expected move means the options market is pricing a reaction of roughly that magnitude in either direction. It is the most useful single number about an upcoming report.
02Why it exists
It exists because information arrives in a lump on a known date. Uncertainty about the result is priced into options before the date; the result removes the uncertainty, and the price of insurance collapses. The pattern — IV up into the event, down after — is one of the more consistent in markets precisely because the calendar is public.
03How it is measured or observed
What to look at before and after a report:
- Expected moveFrom the at-the-money straddle price or directly from the platform. The market's ±X% for the reaction.
- IV rank into the eventHow elevated implied volatility is against its own history. It normally peaks the day before.
- Historical reactionsThe stock's last eight earnings moves. Does it usually move more or less than the expected move?
- The gap and the first hourAfter the report: the opening gap, whether it holds, and how the first hour treats it. This is where the tradeable information is.
- Volatility crushThe collapse in IV after the event — one reason options bought into earnings can lose value even when the direction is right.
Read · seeing it in the market
04How professionals read it
Professionals read the expected move as the size of the coin, and many prefer not to flip it. Holding a directional stock position through a report is a bet on a binary outcome with a known swing; the Advanced rule — a catalyst is not a setup — exists for this.
Their focus is the reaction, not the report. The information that is tradeable arrives at the open after: the gap, whether it holds, what the first hour does with it. A good report sold on heavy volume and a bad report bought are both readable — once they have happened.
They also use the expected move as context for other positions: a stock with earnings in two days does not get added to a swing list, and an index position in earnings season is sized for the giants' reports.
05What strength looks like
The pattern working as designed: IV climbs into the report, the stock gaps roughly within the expected move, IV collapses, and the post-report trend is read from the first hour. Nothing about it needs a prediction.
Illustrative. IV rises into the event and collapses after — regardless of the result.
Source: illustrative teaching data — not market data
06What weakness looks like
The pattern punishing people: a trader buys calls the day before on a 'good chart', the company beats, the stock rises 3% — inside a ±7% expected move — and the calls lose money anyway because IV collapsed. Right direction, wrong instrument, wrong time.
Before (coin flip)
- Result unknown
- IV at its peak; options expensive
- Chart patterns carry no information about the result
- Any directional position is a bet on the coin
After (information)
- Gap direction and size known
- IV collapsed
- First hour shows whether the gap holds
- Reaction can be read and traded
Where the tradeable information lives.
Interpret · what it means for you
07What it means for an investor
For an investor earnings are the quarterly check on the thesis, not a trading event. A long-term holder reads the report for what the business did and what management expects, and ignores the one-day reaction — which reflects positioning as much as results.
08What it means for a trader
For a trader, holding a position into the report means accepting the coin; the Advanced program studies the reaction the next morning, with the opening-conditions checklist. Its catalyst rule is strictest here.
09What it cannot tell you
- The expected move does not say which direction.
- Past reactions do not predict this one's size reliably.
- A beat is not a rally; the reaction depends on expectations and positioning.
Apply · the market right now
10What is happening right now
MAAL TRADING ACADEMY market note
No dated note has been published for this topic yet. We only publish current-market commentary written and dated by the academy — nothing auto-generated.
Data · previous close
Live levels for SPY, QQQ appear here once the licensed market-data feed is connected. We do not show unlicensed or made-up numbers.
How to check this yourself today
- For a stock you follow, find its next earnings date and the expected move.
- Look up its last eight earnings reactions.
- Check whether implied volatility has started rising into the date.
11Visual market example
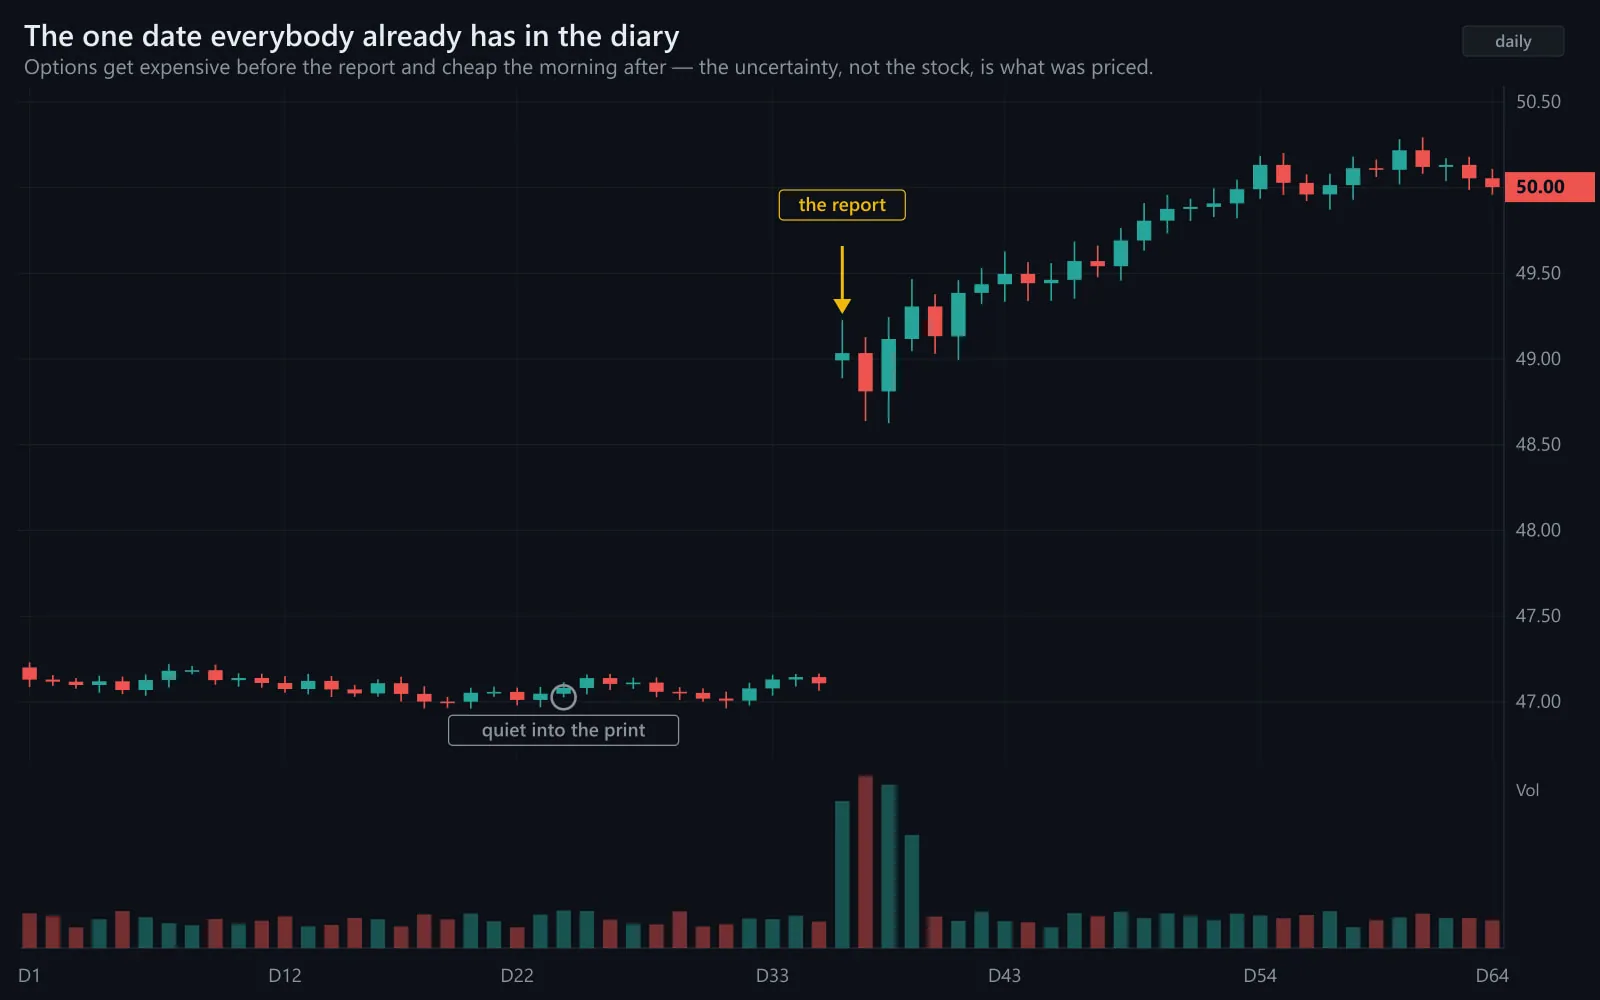
A typical cycle: IV doubles into the report, the stock gaps within the expected move, IV halves the next morning. The trader who held through it bet on a coin; the trader who read the gap at the open had information. Same stock, same report, opposite processes.
Illustrative. The reaction landed inside the priced move — options buyers lost on the crush anyway.
Source: illustrative teaching data — not market data
Review · practise, keep, connect
12Test your understanding
Read the chart the way you would before a trade. Pick the answer, then read why.
1A stock you like reports tonight. Options price a ±9% move. You have a well-defined long setup on the daily chart. What does the Advanced rule say?
Illustrative.
Source: illustrative teaching data — not market data
13Key takeaways
- Implied volatility rises into earnings and collapses after, whatever the result.
- The expected move is the size of the coin; the report is the flip.
- The Advanced program studies the reaction after, not the report before.
- Options bought into earnings can lose to the crush even when the direction is right.
15Learn it in class
Advanced Program · Stage 1 · Finding Stocks in Play
Advanced Day 1: catalysts sorted into tradeable and binary — earnings is the standard example of a catalyst that is not a setup until the reaction is on the screen.