
Understand · what it is and why it exists
01What it is
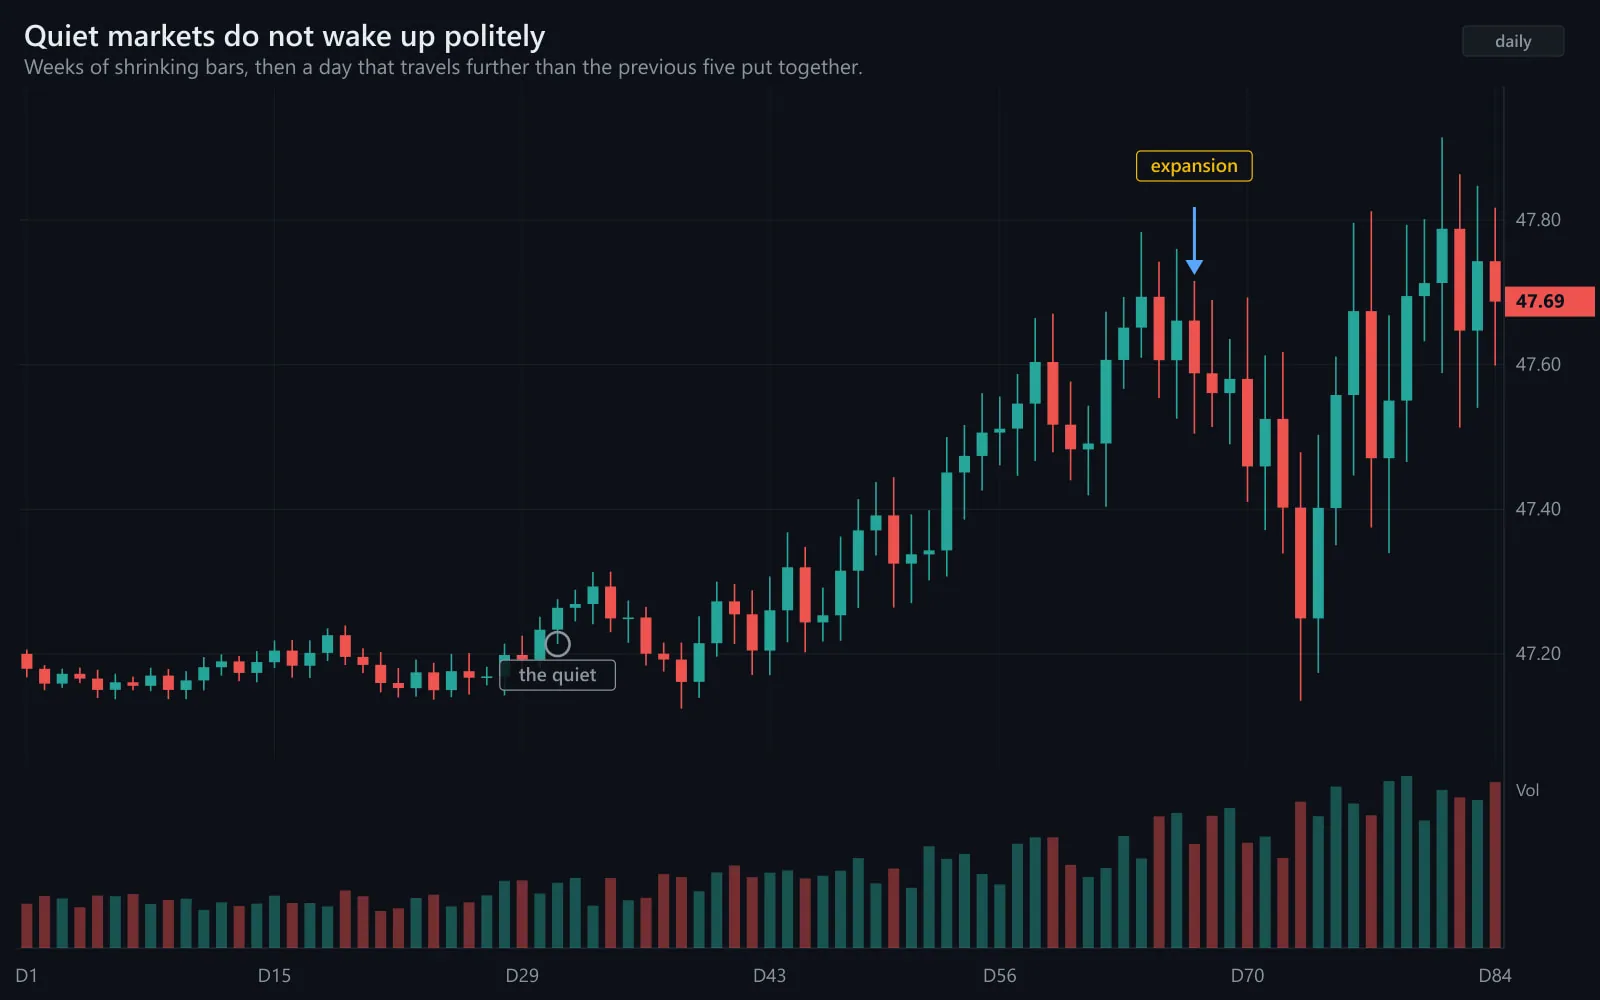
Volatility expansion is the transition from small daily ranges to large ones. It usually starts with a single bar that breaks the quiet — a gap, a range-break on volume — and continues with a run of bars larger than anything in the preceding weeks. ATR jumps; bands widen; the VIX rises.
It is direction-agnostic. Expansion happens in rallies and in sell-offs. What it tells you is that the balance of buyers and sellers has broken, not which side won.
02Why it exists
It exists because contraction stores energy. During quiet periods, positions accumulate on both sides at similar prices and stops cluster just outside the narrow range. When price finally leaves the range, those stops fire, new participants arrive, and movement begets movement. The mechanics are the same in both directions.
03How it is measured or observed
Expansion is seen in the size of bars and in the tools that track it:
- A range bar far above recent averageA day with a range two or three times the 20-day ATR, especially after weeks of sub-average ranges.
- ATR turning upThe 14-day ATR rising after a long decline — the statistical version of the same thing.
- Bollinger Band wideningBands that had pinched together expanding sharply.
- Volume surgeReal expansion comes with volume. A big bar on thin volume is suspect.
- VIX or single-stock IV jumpImplied volatility repricing to the new regime.
Read · seeing it in the market
04How professionals read it
Professionals read the first expansion bar as the most important bar in weeks. Its direction is the direction the stored energy released; its volume says how many participants agreed. They tend to go with it or stand aside — fading the first expansion bar can be costly.
They also immediately recompute size. The ATR that governed position size during contraction is obsolete the moment expansion starts; using it is how a sensible position becomes an oversized one.
And they watch for the expansion to exhaust: the largest bars often come near the end of a move, not the beginning. Expansion that stops expanding — bars getting smaller again — is the early sign that the release is finishing.
05What strength looks like
Expansion with follow-through: a break on volume, the next bars larger still, pullbacks shallow, the move extending for days. The energy was real and the direction was decided by the break.
Illustrative. Weeks of shrinking ranges (grey), then release (navy).
Source: illustrative teaching data — not market data
06What weakness looks like
Expansion that fails: a large bar on thin volume that is fully reversed the next day — a false release. Or expansion that exhausts in a climactic bar after which ranges shrink again. Both are read by what follows the first big bar, not by the bar itself.
Real
- Break on volume
- Next bars larger, same direction
- Pullbacks shallow
- IV reprices and stays
False
- Big bar on thin volume
- Fully reversed next session
- Back inside the old range
- IV spikes and collapses
What follows the first big bar decides.
Interpret · what it means for you
07What it means for an investor
For an investor expansion is when the plan is tested. Long-term holders who sized for calm markets feel the shock most; those who knew what a 3% day felt like in advance tend to stay with their plan.
08What it means for a trader
For a trader expansion is the environment in which breakout setups are usually studied — and the one that demands immediate resizing. The Advanced breakout framework (Level → Trigger → Entry → Stop → Size → Target) has size recomputed on the new range the moment expansion is identified.
09What it cannot tell you
- It does not say how far the move goes; expansion can end in a day or run for weeks.
- The first bar's direction can be a trap on thin volume.
- It cannot be timed from the contraction that precedes it.
Apply · the market right now
10What is happening right now
MAAL TRADING ACADEMY market note
No dated note has been published for this topic yet. We only publish current-market commentary written and dated by the academy — nothing auto-generated.
Data · previous close
Live levels for SPY, QQQ appear here once the licensed market-data feed is connected. We do not show unlicensed or made-up numbers.
How to check this yourself today
- Compare today's range on SPY with its 20-day ATR.
- Check whether the 14-day ATR is rising or falling.
- Look at the last big bar: was it on expanded volume, and was it followed through?
11Visual market example
The cycle on one page: compression for weeks, then a release whose every bar dwarfs the quiet period. The contraction gave the signal that something was coming; the first expansion bar gave its direction; the volume gave its credibility.
Illustrative. Magnitude predicted; direction decided at the break.
Source: illustrative teaching data — not market data
Review · practise, keep, connect
12Test your understanding
Read the chart the way you would before a trade. Pick the answer, then read why.
1After three quiet weeks, a stock gaps up 6% on five times average volume and closes near its high. A colleague says it has 'gone too far' and wants to short it. Your read?
Illustrative.
Source: illustrative teaching data — not market data
13Key takeaways
- Expansion is the release of energy stored in contraction; it is direction-agnostic.
- The first expansion bar and its volume are the most important information in weeks — fading it can be costly.
- Recompute size the moment expansion starts.
- Expansion that stops expanding is the early sign of exhaustion.
15Learn it in class
Advanced Program · Stage 5 · Executing Breakouts
Advanced: breakouts — the first expansion bar, its volume, and why 'it has gone too much' is not a setup.